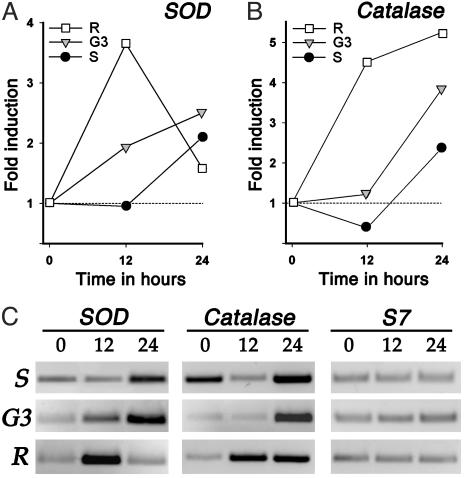
Fig. 5.
RT-PCR analysis of midgut mRNA induction in response to bloodfeeding. (A) Fold induction of SOD relative to unfed values. (B) Fold induction of catalase relative to unfed values. (C) Inverted image of the RT-PCR products stained with ethidium bromide after agarose electrophoresis. The intensity of the RT-PCR bands was determined and used to calculate the fold inductions. S7 was used as an internal control to equalize the amount of cDNA template used in all PCRs.

