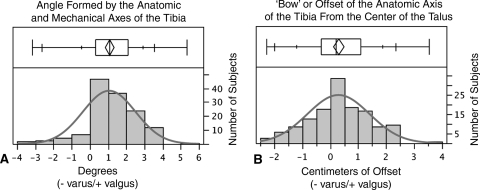
Fig. 3A–B.
Frequency distributions of the (A) angle formed by the anatomic and mechanical axes of the tibia and (B) bow of the tibia as quantified by the offset of the anatomic axis from the center of the talus are shown. Descriptive statistics include the quantile plot and the number of patients in each column.

