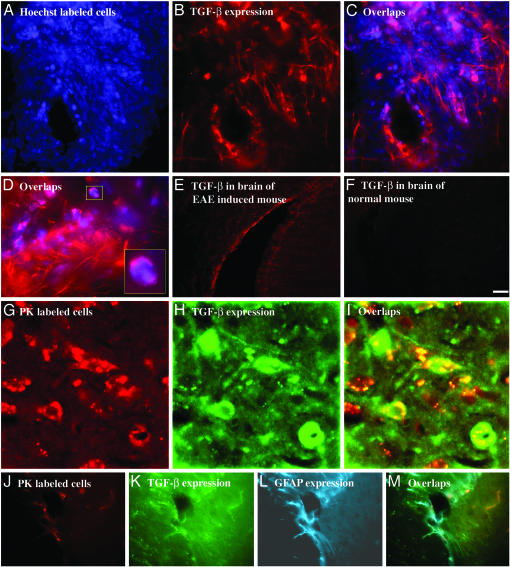
Fig. 3.
Immunohistochemical analysis of TGF-β expression by GA-specific cells in brains of EAE-induced mice. (A–D) Perivascular infiltration in the cortex. (G–I) 3D reconstruction of PK-labeled cells in the thalamus by confocal scanning microscope. (J–M) Nonoverlapping distribution of TGF-β-expressing GA-labeled cells and additional population of cells expressing TGF-β and GFAP in tissue surrounding a blood vessel. Controls demonstrate TGF-β in corresponding brain region of an EAE-induced mouse (E) and a normal mouse (F) in the cortex. (Scale bar: A–C, 50 μm; D, 20 μm; E, F, and M–P, 100 μm; G–L, 10 μm.)

