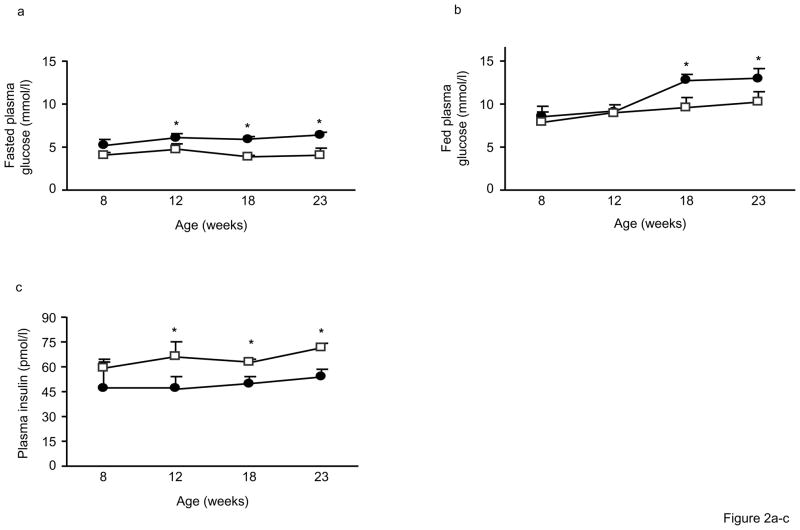
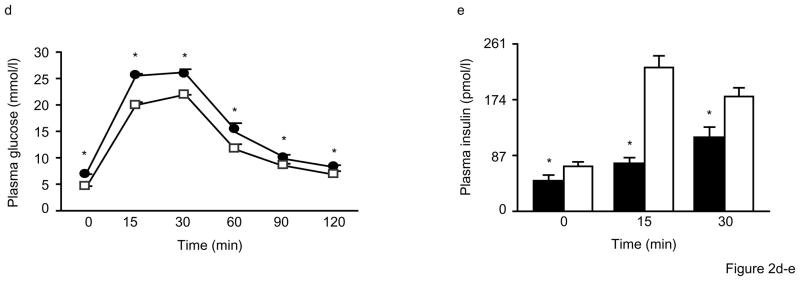
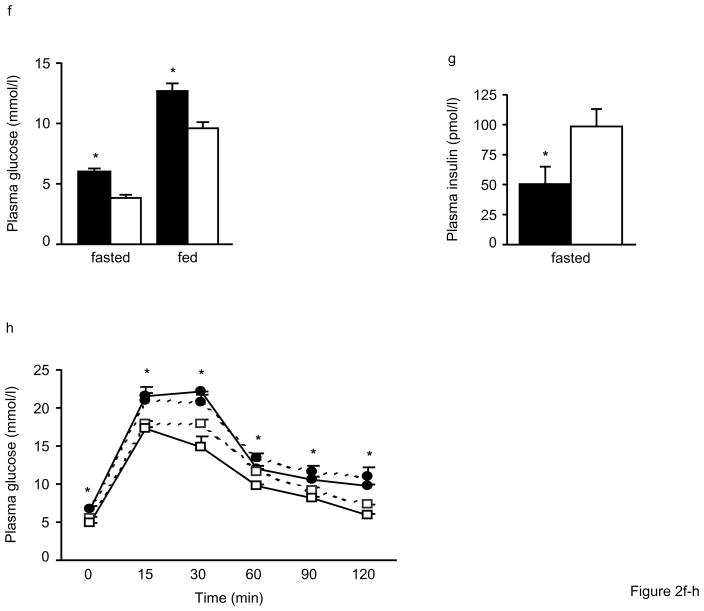
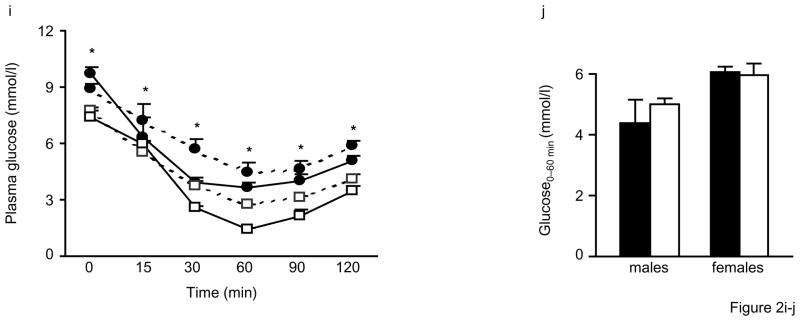
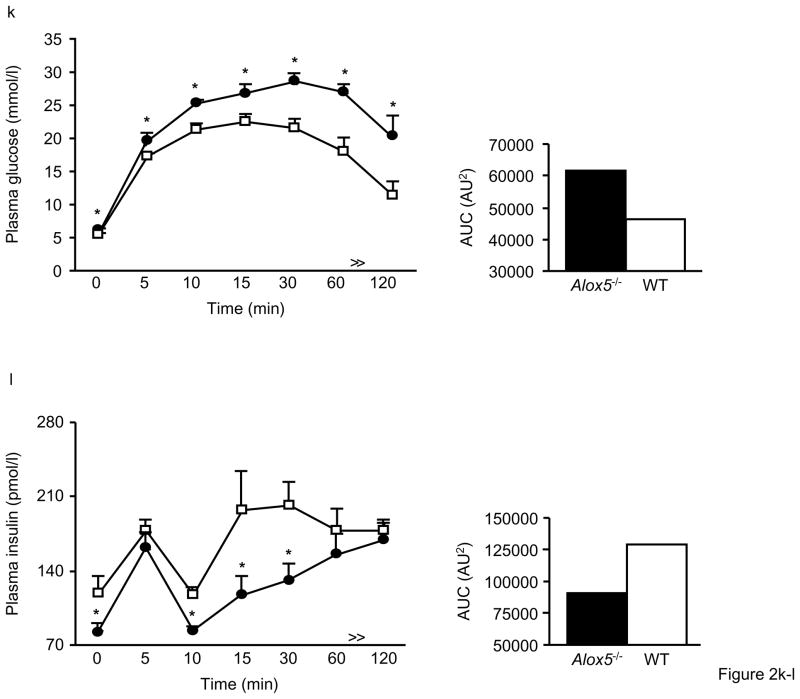
Figure 2. Impaired glucose tolerance and insulin secretion in Alox5−/− mice.
Fasting plasma glucose levels are significantly higher beginning at 12wks of age (a), fed plasma glucose levels become significantly elevated starting at 18wks (b), and fasting insulin levels are significantly lower beginning at 12wks (c) in male and female Alox5−/− mice (filled circles) compared to WT (open squares). Post glucose injection during an IPGTT, plasma glucose levels are significantly higher at all time points (d) whereas plasma insulin levels are lower at the 0, 15, and 30min time points (e) in 12wk-old male Alox5−/− mice (filled circles or bars) compared to WT (open circles or bars). Fasted and fed plasma glucose levels are higher (f) and fasting insulin levels are lower (g) in 18wk-old male and female Alox5−/− mice (filled bars) compared to WT (open bars). 18wk-old Alox5−/− male (filled circles, dashed line) and female (filled circles, solid line) mice exhibit significantly higher glucose levels at all time points after a bolus glucose injection during an IPGTT (h) compared to male (open squares, dashed line) and female (open squares, solid line)WT mice. An IPITT demonstrates that, despite starting higher at baseline, plasma glucose levels decrease at the same rate after administration of an insulin bolus in 18wk-old male (filled circles, dashed line) and female (filled circles, solid line) Alox5−/− mice compared to age-matched male (open squares, dashed line) and female (open squares, solid line) WT mice (i). This is further shown by the comparable changes in glucose levels from baseline to 60min post injection (j) in Alox5−/− mice (filled bars) compared WT (open bars). An IPGTT of 23wk-old Alox5−/− mice (filled circles) demonstrates decreased glucose clearance (k) compared to WT (open squares), which results, at least in part, from impaired insulin secretion as shown at the baseline, 10, 15, and 30min time points (l). All data are from 10–15 mice of each genotype at the indicated ages. IPITT and IPGTT experiments were performed as described in the Materials and Methods section. AUC, area under the curve; Data are shown as mean + SE. *P < 0.05 between Alox5−/− and WT mice.

