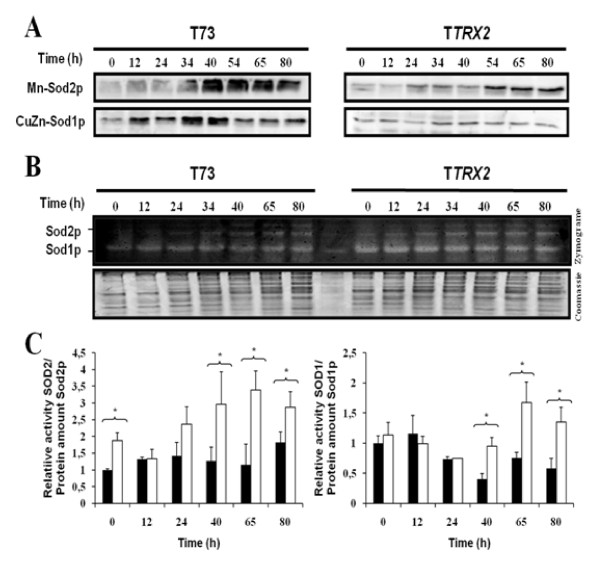
Figure 5.
Superoxide dismutase activity along bench-top trials of biomass propagation for T73 (black bars) and TTRX2 (white bars) strains. Western blot analysis of cell extracts against Sod1p and Sod2p after electrophoresis under denaturing conditions (A). Panel B shows Zymogram obtained by native gel electrophoresis of cell extracts and SOD activity staining. (C) Mn-SOD and CuZn-SOD activity was calculated from zymogram density analysis and normalized to total protein amount from Coomassie stained gel. The specific activity was obtained as a result to normalized activity data to Sod1p and Sod2p protein amount from western blot analysis. In order to avoid technical errors as different exposure times, western blots and zymogram for both strains were carried out simultaneously in three independent experiments.

