
Figure 5.
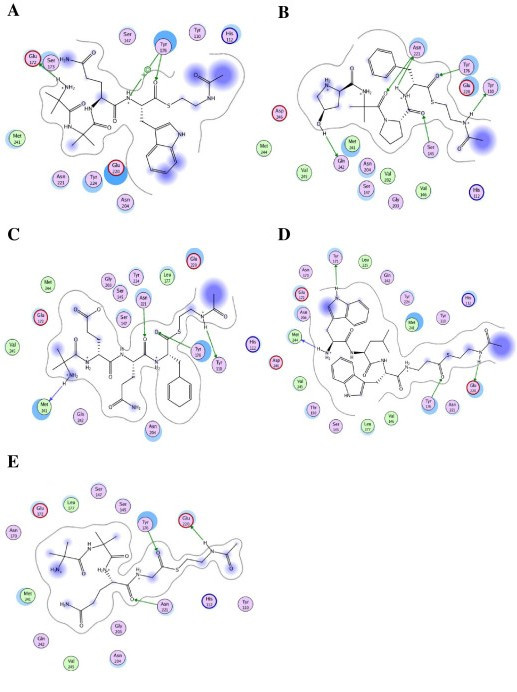
Ligand interaction plot of the ASEDock-generated reductase Chrysopermin (panel A), Antiamoebin (panel B), Alamethicin (panel C), Gramicidin (panel D) and Trichotoxin (panel E). The plot depicts the 2D ("flattened") spatial arrangement of the ligand and the R domain with respect to key interactions. The proximity contour (dashed lines) and solvent exposed areas (solid purple spheres) of the ligand atoms are indicated as the polar (pink), hydrophobic (green), and solvent-exposed (light blue shadow) binding pocket amino acids. Acidic and basic residues are highlighted with red and blue halos, respectively.