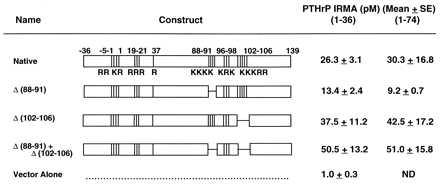
Figure 4.

Map of the wild-type and native PTHrP constructs, the three deletion mutants, and vector alone. Values on the right indicate the concentrations of PTHrP in the conditioned medium from the various cell lines. Note that the mutant PTHrP constructs lead to similar levels of PTHrP production as the native construct, and that all constructs lead to the far greater production of PTHrP than the vector-transfected A-10 cells.
