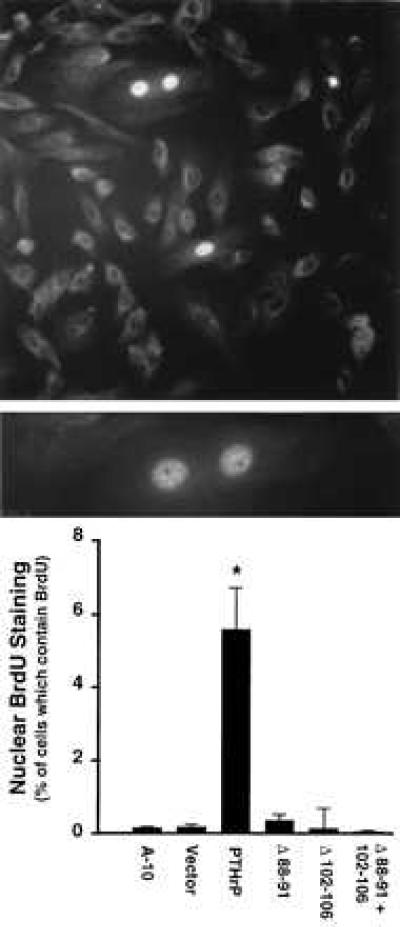
Figure 6.

(Top) PTHrP immunocytochemistry showing nuclear staining in PTHrP-overexpressing A-10 cells. (×200.) (Middle) A higher power magnification of the PTHrP-overexpressing cell nuclei. (×400.) Note that the pattern is a diffuse reticulated pattern and that the two most prominent nuclei are in a single dividing cell. For immunocytochemistry, negative controls (no primary antibody and competition with excess PTHrP) showed no staining (data not shown). (Bottom) The percentage of nuclei that contain PTHrP in the various A-10 cell clones. Each bar represents the mean of nine slides, and 300-1000 cells were counted per slide by two blinded observers. The bars indicate standard error; ∗, P < 0.01.
