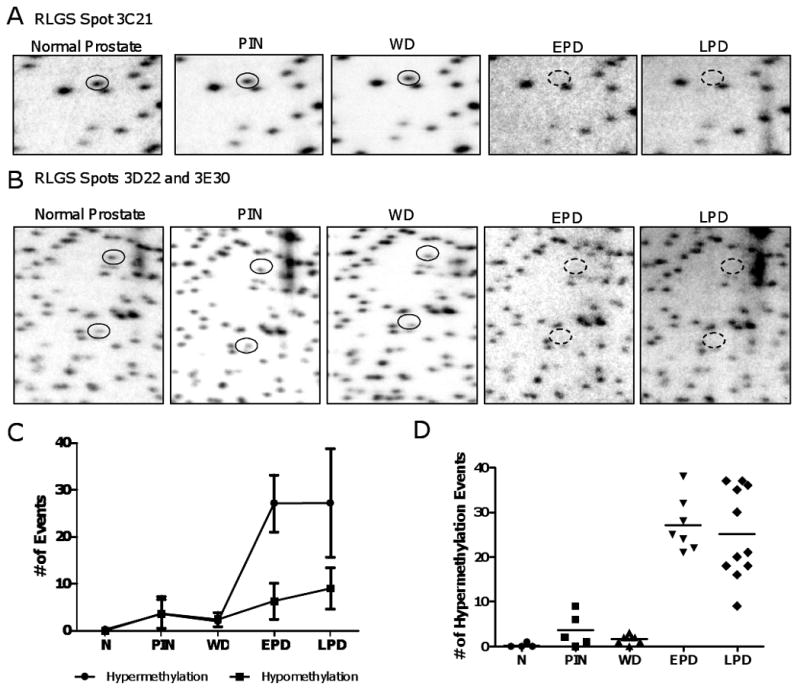
FIGURE 3.

Locus-specific DNA hypermethylation during TRAMP tumor progression. A. RLGS analysis showing Spot 3C21, corresponding to Nrnx2 (solid circle). The dashed circle illustrates the position of spot loss (hypermethylation event), seen exclusively in the EPD and LPD samples. B. RLGS analysis showing Spots 3D22 (upper spot) and 3E30 (lower spot), corresponding to Cdkn2a and Gsc, respectively (solid circles). The dashed circles illustrate the position of spot loss (hypermethylation events), seen exclusively in the EPD and LPD samples. C. RLGS spot losses (hypermethylation events) and RLGS spot gains (hypomethylation events) in each sample group. Error bars indicate +/- 1 SD. D. Hypermethylation events in each sample analyzed by RLGS. Dots represent individual samples and horizontal bars indicate the mean of each sample group.
