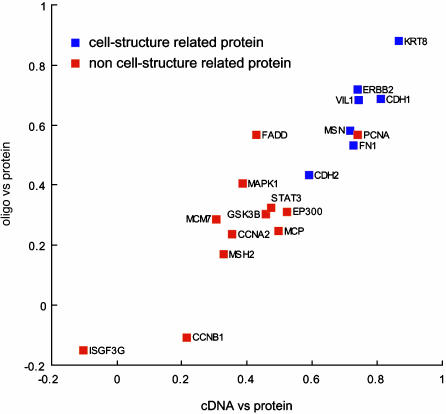
Fig. 4.
Transcript/protein correlation coefficients. The data were from two independent mRNA profiling platforms (cDNA and oligonucleotide arrays). Each point represents a single target protein. Molecular species were divided into two major categories according to SWISS-PROT and/or MIPS. Blue squares, cell-structure-related proteins; red squares, non-cell-structure-related proteins.

