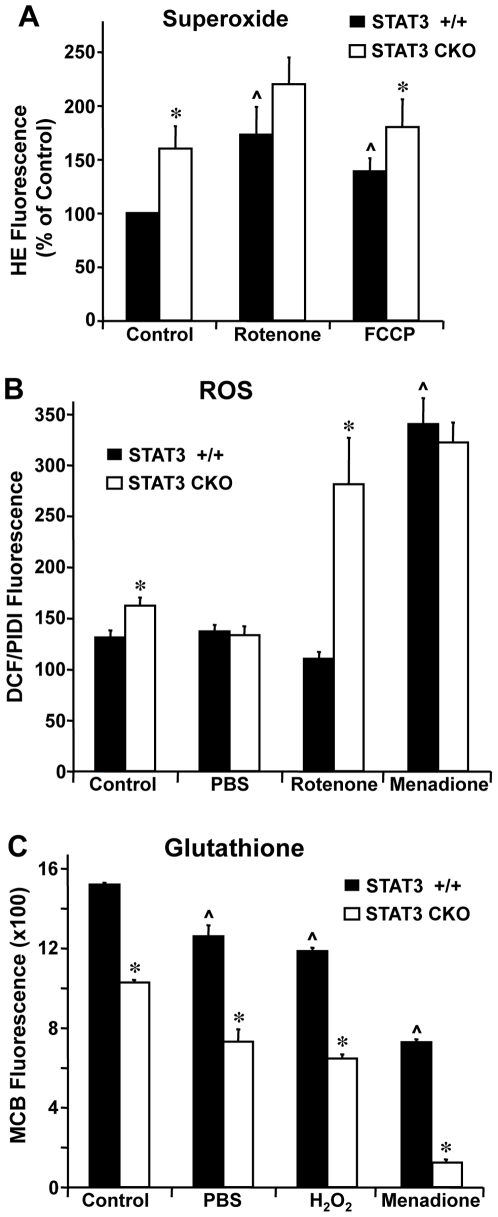
Figure 2. Oxidative stress studies using fluorescent probes.
Cortical astrocytes cultured at passage 2 or 3 were assayed in the presence of 25 µM rotenone, 25 µM FCCP, 100 µM menadione, PBS, or 0.5% DMSO (vehicle control). (A) Superoxide generation was measured using the fluorescent probe HE as described in Materials and Methods and was consistently higher in STAT3-CKO cells. Data, expressed as per cent of STAT3 +/+ control, represent means of 7–8 determinations ± SEM. * p<0.05 compared with STAT3 +/+. (B) Generation of ROS was measured using DCF. Values are expressed as DCF fluorescence after 1 hr incubation normalized to total cell number derived by PI fluorescence in the presence of 160 µM digitonin (PIDI). Values represent means of 6–34 determinations ± SEM. * p<0.01 compared with STAT3 +/+ cells and ∧ p<0.05 compared with corresponding vehicle-treated control by 2-way ANOVA with Bonferroni post-hoc test. (C) Glutathione (GSH) levels were measured using 40 µM MCB after 30 min incubation at 37 °. Relative fluorescence values were normalized to total cell number and represent means of 6 determinations ± SEM. * p<0.001 compared with corresponding STAT-3 +/+ cells and ∧ p<0.05 compared with corresponding control using 2-way ANOVA with Bonferroni post-hoc test.

