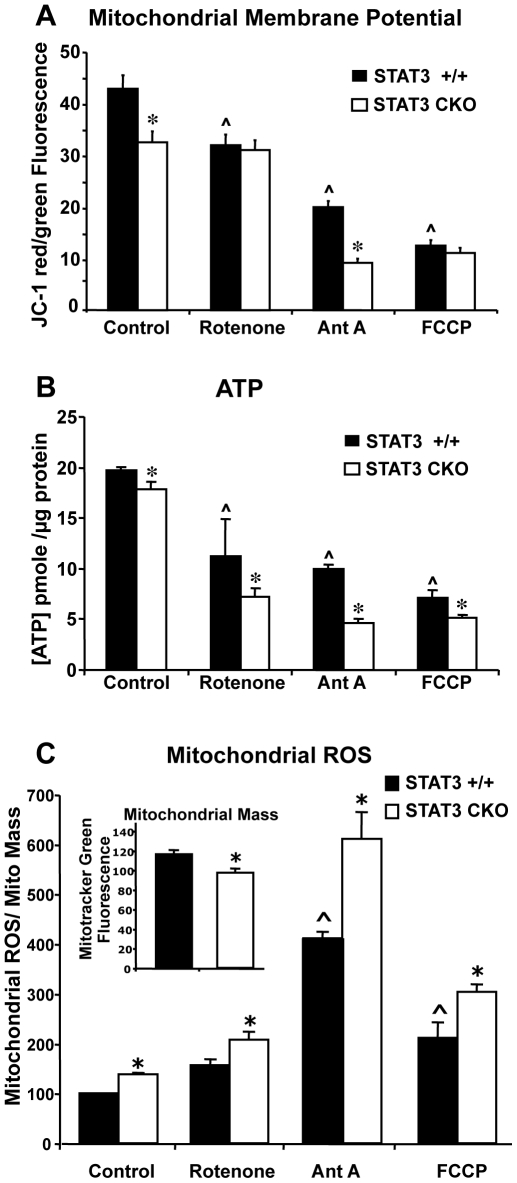
Figure 3. Analysis of mitochondrial function.
Mitochondrial membrane potential (A), ATP levels (B), and mitochondrial ROS (C) of cortical astrocytes. Cells treated with the mitochondrial inhibitors 25 µM rotenone, 10 µM antimycin A (Ant A)or 25 µM FCCP. (A) Cells cultured in 48-well plates were first exposed to the inhibitors or vehicle control (0.5% DMSO) for 1 hr prior to addition of 1µM JC-1. After an additional hour of incubation in a CO2 incubator, both red (Ex = 530, Em = 590 nm) and green (Ex = 485, Em = 530 nm) fluorescence was measured. After background subtraction, the ratio of red to green fluorescence was calculated as a measure of mitochondrial membrane potential. Values represent means of 16 determinations ± SEM. * p<0.05 compared with STAT3 +/+ using 2-way ANOVA with Bonferroni post-hoc test. ∧ p<0.05 compared with control. (B) ATP levels were measured using the Promega CellTitre-Glo luminescence assay and a standard curve for ATP quantification. Values represent means of 6 determinations ± SEM. The experiment was repeated twice with similar results. (C) Mitochondrial-specific ROS assays were performed in 96-well culture plates as described in Materials and Methods. Values represent means of 60 determinations ± SEM. * p<0.05 compared with STAT3 +/+ using 2-way ANOVA with Bonferroni post-hoc test. ∧ p<0.05 compared with vehicle-treated control cells.

