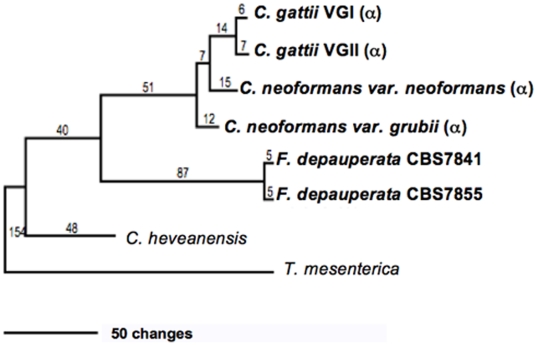
Figure 1. Phylogeny of F. depauperata and closely related species.
A Maximum Parsimony tree depicting the relationship between both strains of F. depauperata and the pathogenic Cryptococcus species using a concatenated data set derived from two coding genes. Numbers above the branches indicate changes. Statistical support was calculated from 1,000 bootstrap replicates. Bootstrap values were >70% in all branches (values not shown). The “α” indicates strains with the MATα locus. Unrooted trees for Maximum Parsimony and Maximum likelihood are shown in supporting File S1.

