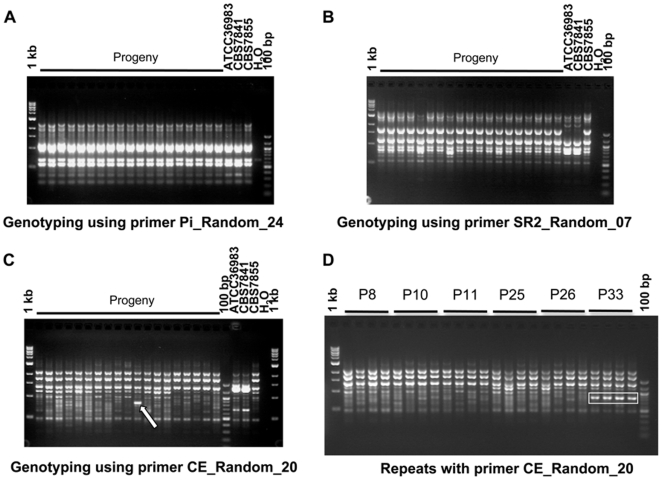
Figure 2. Genetic diversity between isolates of F. depauperata and among the progeny of isolate CBS7855.
Panels A, B and C shows representative results from three of the 12 different random primers that were used to evaluate the genetic similarity of both strains of F. depauperata, and progeny from CBS7855. Strains CBS7841 and ATCC36983 represent the same isolate, but obtained from two different culture collections (ATCC and CBS). A total of 39 progeny were tested, but only 19 are shown in panels A, B & C. Panel A shows the results from one of the random primers (Pi_Random_24) that generated an identical PCR pattern for all isolates (CBS7841, CBS7855, and also among the progeny from CBS7855). Panel B and C shows the results from the two random primers (SR2_Random_07, and CE_Random_20) that displayed different PCR patterns for CBS7841 and CBS7855. Primer CE_Random_20 also revealed a unique band (white arrow) present in progeny #33 (P33), but not present in the parental strain CBS7855. Panel D shows the consistency and reproducibility of the unique band observed in P33 by independent repetitions of the PCR experiments. Rectangles indicated the unique PCR band that is present P33 but absent from the parental strain and other progeny. P8, P10, P11, P25, P26, and P33 correspond to progeny of CBS7855. 1 kb∶1 kb DNA ladder; 100 bp∶100 bp DNA ladder; H2O: negative control for the PCR reaction.

