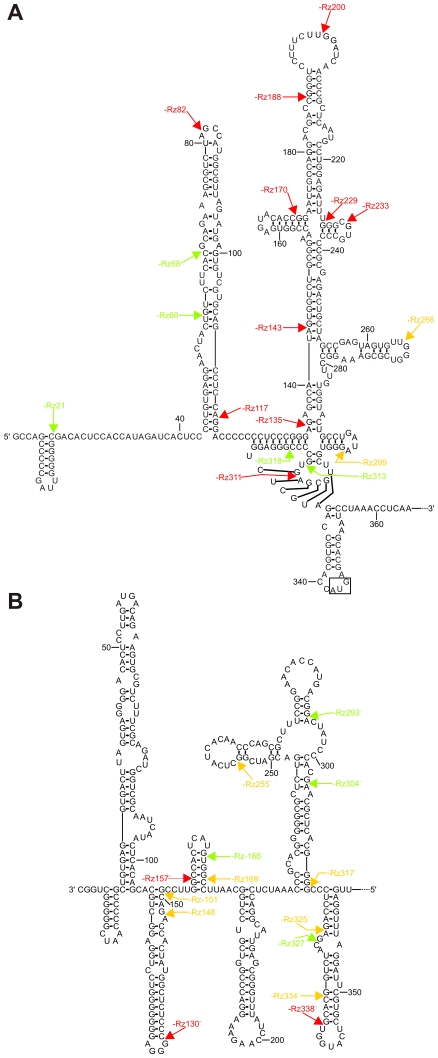
Figure 5. Analysis of the cleavage activity of the SOFA-HDV ribozyme collections.
(A) and (B). The cleavage activity levels observed in vitro are illustrated on the proposed secondary structures of both the HCV (+) and (−) strands, respectively. The secondary structures shown are as previously reported [13], [40]. The SOFA-HDV ribozymes exhibiting either no, or relatively low cleavage activities (<10%), are indicated in red. Those exhibiting moderate cleavage activities (between 10% and 20%) are indicated in yellow, while those exhibiting relatively high cleavage activities (>20%) are indicated in green. The arrows indicate the proposed cleavage position of each SOFA-HDV ribozyme.

