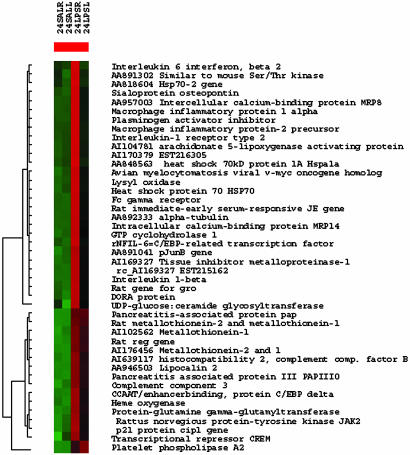
Fig. 3.
Transcriptional patterns during EIM. Cluster analysis of genes and EST that have fold change 5 or higher at 24 h after a single LPS injection. High transcriptional fold changes accompany the histological image of acute myocarditis with focal areas of aseptic necrosis. In each treatment group, genes colored in red are up-regulated, and genes colored in green are downregulated when compared to the average gene expression across all conditions. Note that expression appears to be higher in the RV for most transcripts. The number of transcripts that have fold change 5 or higher is significantly larger in the RV than in the LV (Inset). Accession number denotes EST. 24SALR, saline treated RV at 24 h; 24SALL, saline treated LV at 24 h; 24 LPSR, LPS treated RV at 24 h; 24 LPSL, LPS treated LV at 24 h.

