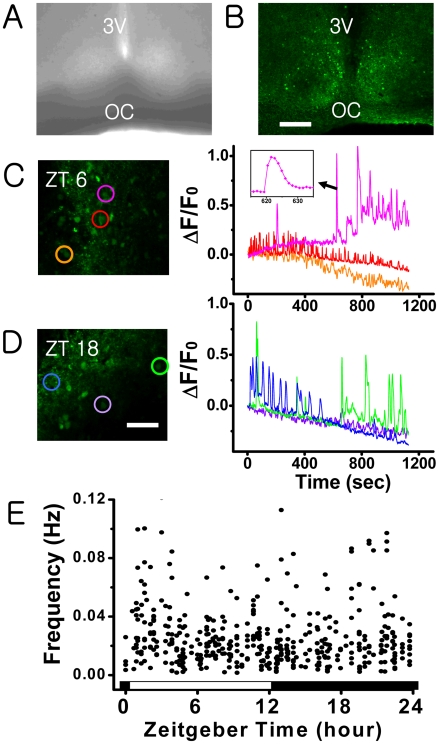
Figure 1. Spontaneous Ca2+ spikes in rat acute SCN slices:
Phase contrast image (A) and fluo-4 AM (20 µM) stained fluorescent image (B) of a hypothalamic brain slice containing rat SCN (scale bar, 200 µm). (C and D) Time series of spontaneous [Ca2+]c spiking activities of SCN neurons obtained at ZT 6 and ZT 18 (scale bar, 50 µm). Each colored circular mark in C and D matches with the time series shown in the same color. The bandwidth of each calcium spike varies significantly from one cell to the other, typically ranging from 5–60 seconds (cf. graph in inset). (E) The mean frequency of spontaneous Ca2+ spikes in SCN as a function of zeitgeber time. Each dot marks the mean frequency of the Ca2+ spikes exhibited by one cell during a period of 800–1000 sec. The data were collected from the [Ca2+]c active cells in 1–3 different slices each hour, totaling 475 cells.

