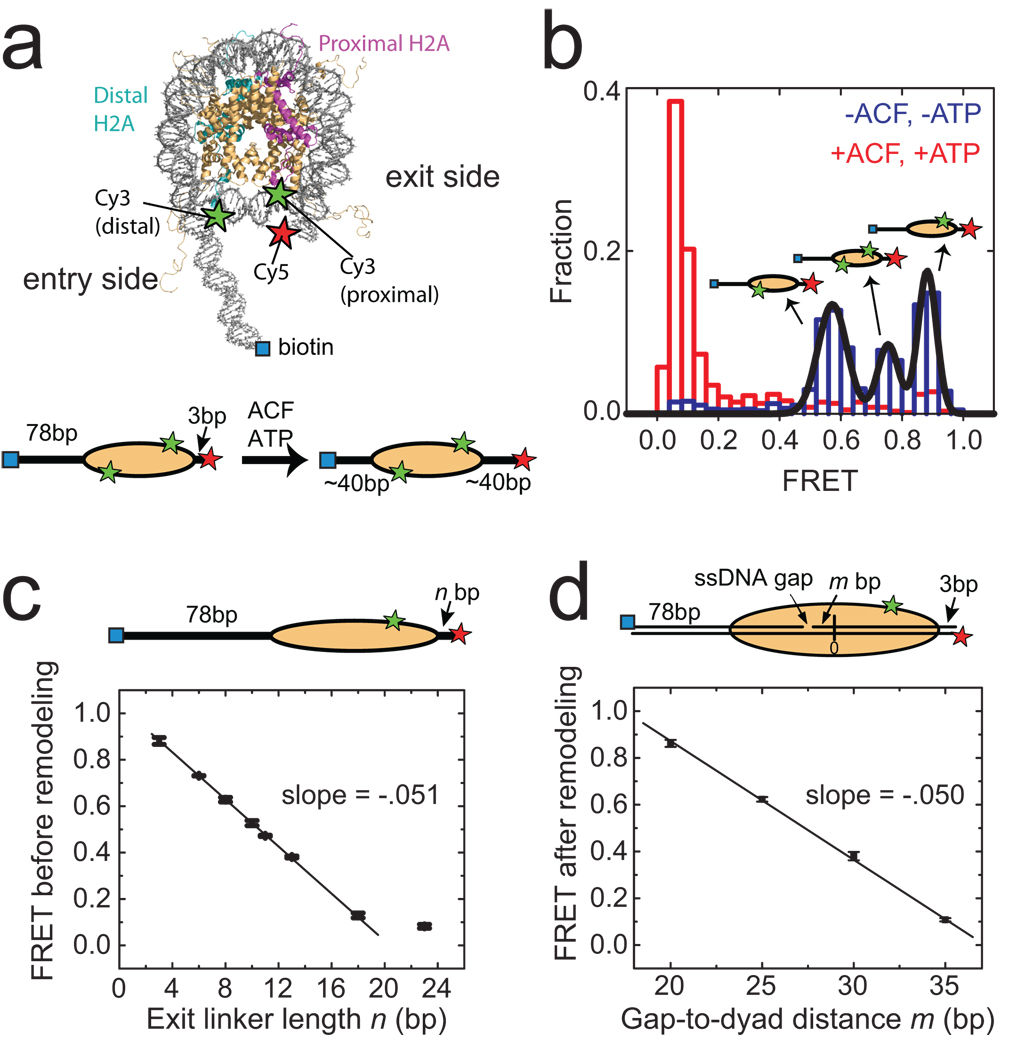
Figure 1. Monitoring ACF-catalyzed nucleosome remodelling by single-molecule FRET.
a, (upper panel) The nucleosome structure33 with labelling sites for Cy3 and Cy5 indicated by green and red stars, respectively. Additional B-form DNA is modelled onto the entry and exit sides of the nucleosome to show the flanking DNA linkers. (lower panel) A linear nucleosome scheme showing the footprint of the histone octamer (yellow oval) on the DNA (black line) before and after ACF-catalyzed remodelling. b, The FRET distribution of the n = 3 bp nucleosomes before (blue bars) and after (red bars) remodelling. The three initial peaks centred at FRET = 0.88, 0.75 and 0.58 (derived from Gaussian fit, black line) result from the three distinct Cy3-labeling configurations. After equilibration with ACF and ATP, the FRET values reduce to below 0.1. c, The initial FRET value as a function of the exit linker DNA length (n). The data were fit to a line with a slope of −0.051 ± 0.002 (black line). The last point near zero FRET is excluded from the linear fit. In this and subsequent figures, data from nucleosomes with a single Cy3 dye on the proximal H2A subunit are presented. The selection criteria for these nucleosomes are described in Online Methods. d, The final FRET values after remodelling by ACF as a function of m, the number of base pairs between the ssDNA gap and the nucleosome dyad (denoted as 0). The linear fit (black line) gives a slope of −0.050 ± 0.002. Error bars are ± s. e.m.

