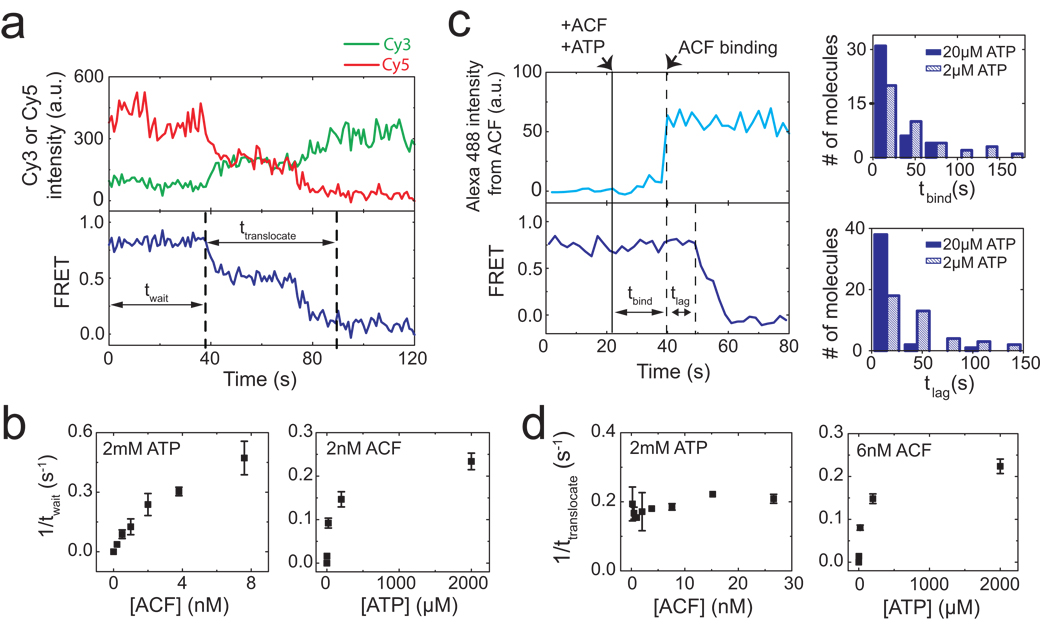
Figure 2. Real-time dynamics of ACF-catalyzed nucleosome translocation.
a, Donor fluorescence (green), acceptor fluorescence (red), and FRET (blue) traces showing the ACF-induced remodelling of a single nucleosome (n = 3 bp). ACF (6 nM) and ATP (2 µM) were added at time zero. The durations of the waiting phase and the translocation phase are denoted as twait and ttranslocate, respectively b, Dependence of the mean twait value on ACF and ATP concentrations. c, Simultaneous monitoring of the binding of ACF and the remodelling of nucleosomes. (left panels) The upper trace shows the fluorescence signal from the Alexa 488-labelled ACF. The lower trace shows FRET between Cy3 and Cy5 on the nucleosome. ACF (4 nM) and ATP (20 µM) were added at the time indicated by the solid black line. The binding event of ACF (indicated by the first dashed line) further divides twait into two phases, tbind and tlag. (right panels) The distributions of tbind and tlag at two different ATP concentrations and 4 nM ACF. The distributions at different ATP concentrations are statistically distinct with 95% confidence for tbind and more than 99% confidence for tlag according to the Kolmogorov-Smirnov test. d, Dependence of the mean ttranslocate value on ACF and ATP concentrations. Error bars are ± s.e.m.

