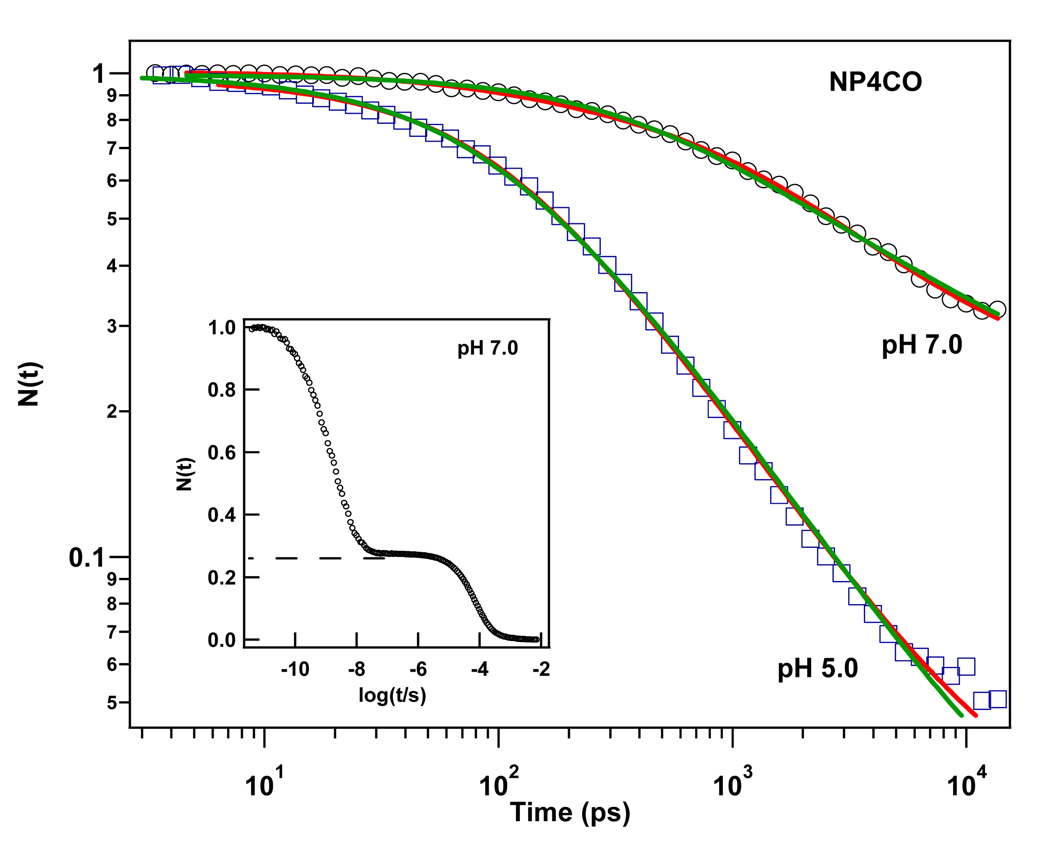
Figure 5.
Kinetic traces of CO rebinding to NP4 at pH 7.0 and pH 5.0. (pumped at 403 nm and probed at 438 nm). The solid lines are fits using the heme doming distribution model: The red line represents a fit function that assumes a separate distribution for each of the open and closed states. The green line represents a fit function with only a single “average” distribution. The data are normalized to unity at time zero. The inset represents the rebinding kinetics of CO to NP4 at pH 7.0 over a wider time window. The slower bimolecular phase has a ~25% amplitude.

