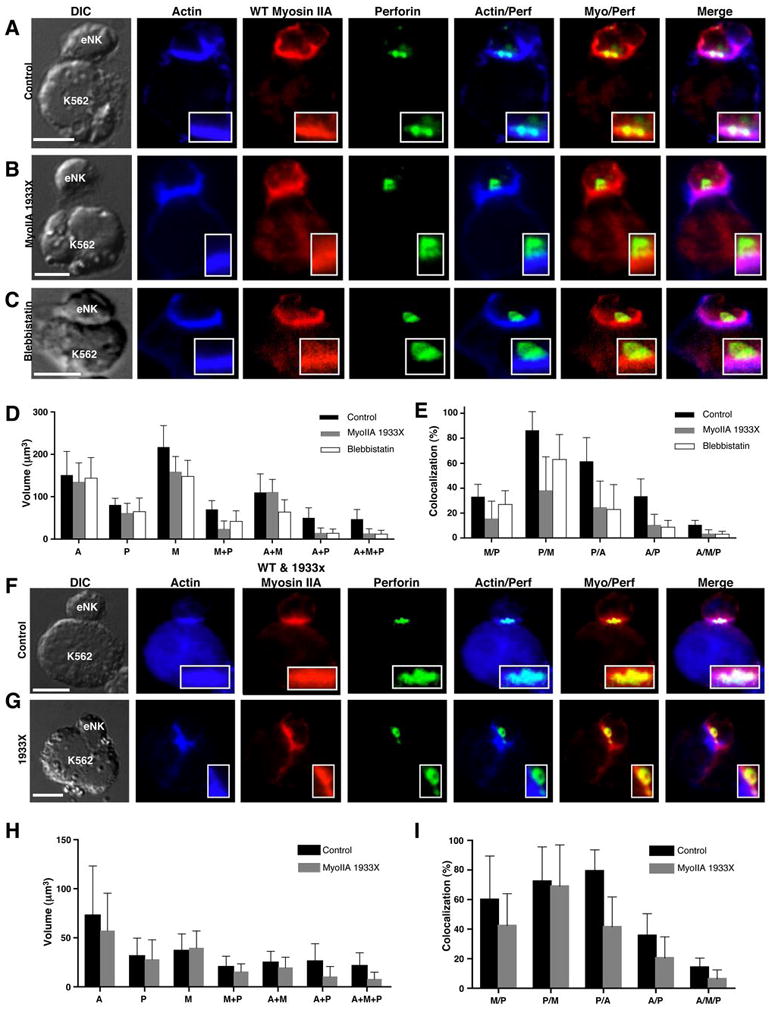
Figure 2.

Confocal fluorescent micrographs of control donor (A,F), myosin IIA 1933X patient 1 and 3 (B,G), and blebbistatin-treated control (C) eNK cells conjugated with K562 target cells. Differential interference contrast (DIC), actin (blue), wild-type myosin IIA (red), perforin (green), and overlays are shown. Scale bar = 5 μm. Anti-myosin IIA antibodies were utilized that recognize wild-type (A–C) or both mutant and wild-type forms (F–G). (D,H) Mean volume ±SD occupied by actin (A), perforin (P), myosin IIA (M), or a combination is shown for control (black), myosin IIA 1933X patient (gray), and blebbistatin-treated (white, D only) eNK cells conjugated with K562 cells. (E, I) Mean percent colocalization ±SD among the fluorescent volumes in control (black), myosin IIA 1933X patient (gray), and blebbistatin-treated (white, E only) eNK cells conjugated with K562 cells. The percentage of myosin IIA colocalized with perforin (M/P), perforin with myosin (P/M), perforin with actin (P/A), actin with perforin (A/P), and actin with myosin and perforin (A/M/P) are shown. ≥10 cells per condition are represented.
