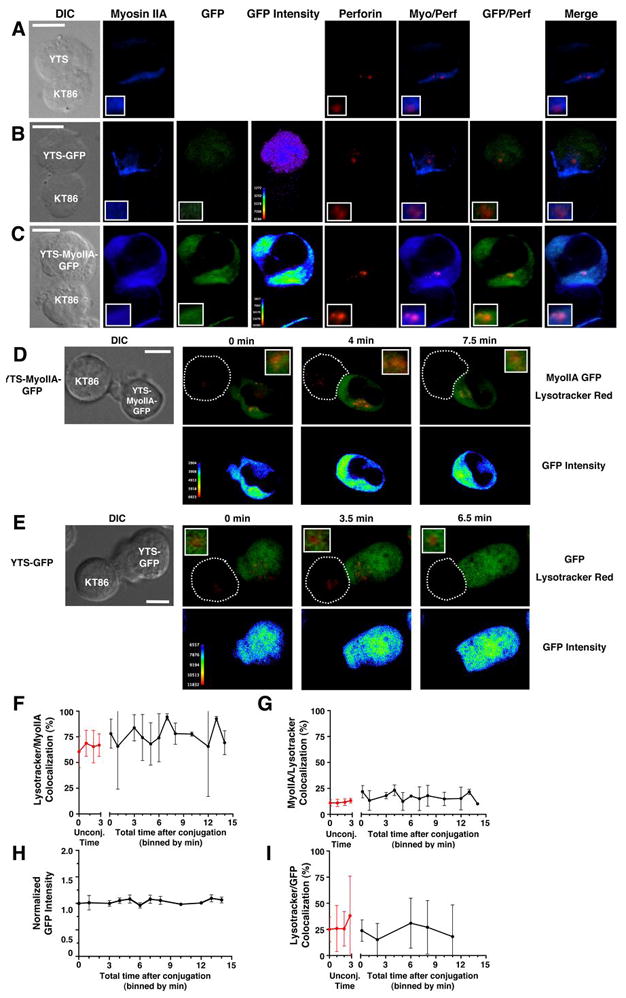
Figure 4.

Myosin IIA colocalization with lytic granules in fixed (A–C) and live (D–I) NK cells. (A–C) Cytolytic conjugates between YTS (A) YTS-GFP (B), or YTS-Myosin IIA-GFP (C) cells and a KT86 target cell. Differential interference contrast (DIC) and confocal fluorescent images for myosin IIA (blue), GFP (green), GFP intensity (rainbow), perforin (red), and overlays of fluorescence are shown. Inset panels in lower left corner show an enlargement of the area containing lytic granules. (D–E) Live cell confocal images of Lysotracker Red-loaded YTS-MyoIIA-GFP (D) or YTS-GFP (E) cells conjugated with KT86 target cells. The DIC image taken at 0 min is shown (left). Top panels show an overlay of Myosin IIA-GFP (YTS-MyoIIA-GFP) or GFP (YTS-GFP) (green) with Lysotracker Red (red); bottom panels use a pseudocolor scale to show intensity of GFP only (Lysotracker Red fluorescence was removed prior to applying color scale). In all images, an intensity threshold has been applied to the fluorescent signal so that only 3 SD above the mean intensity for each fluorophore is shown. Scale bars = 10 μm. (F–G) Mean percent ±SD Lysotracker Red fluorescent area colocalized with myosin IIA-GFP fluorescent area (F) and mean percent ±SD myosin IIA-GFP colocalized with Lysotracker Red (G) in YTS-Myosin IIA-GFP cells over time after conjugation with KT86 target cells (black lines). Red lines indicate percent colocalized fluorescent areas ±SD in unconjugated cells over time. (H) Mean GFP fluorescence intensity ±SD over time at the colocalized area between myosin IIA-GFP and Lysotracker Red after conjugation to target cells. (I) Mean percent ±SD Lysotracker Red fluorescent area colocalized with GFP fluorescent area of YTS-GFP cells over time after conjugation with KT86 target cells (black line). Red line indicates percent colocalized area ±SD in unconjugated cells. All graphs represent live cell image sequences of ≥8 conjugates.
