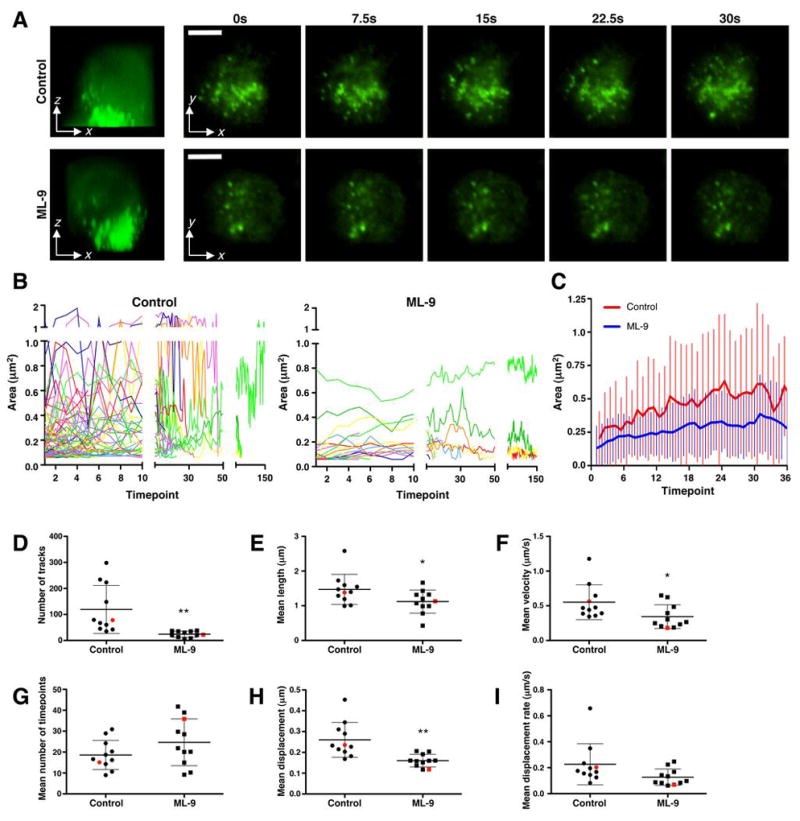
Figure 9.

Evaluation of myosin IIA in lytic granule dynamics. (A) Control or ML-9-treated YTS cells with polarized lytic granules (as determined by confocal fluorescent microscopy, at left) were imaged on an anti-CD28-coated glass surface using TIRFm for 30 seconds at a rate of 5 images per second. Scale bar = 5 μm. Representative cells of 11 individually analyzed cells for each condition are shown and were chosen based upon their representation of the median number of tracks of all cells analyzed. (B) Change in area over time for individual granules in the representative cells. y-axis was divided at 1 μm2 as exceeding values were likely not to represent individual granules but rather conglomerates. (C) Mean ±SD lytic granule area for the cells depticted in (A,B) is shown over the number of timepoints representing the mean duration of tracks in ML-9-treated cells. The mean number of timepoints in the control-treated YTS cell tracks (red) was less than in the ML-9-treated cells (blue). (D–I) The total number of tracks (D), mean track length (E), mean track velocity (F), mean number of timepoints for tracks (G), mean track displacement (H), mean track displacement rate (I) plotted to show each of 11 independent control and ML-9-treated replicate cells, ±SD. Red points in each condition indicate the representative cell shown in (A) and (B). Difference between the means of control and ML-9-treated cells in (D,E,F,H) was significant (p<0.05), and in (I) demonstrates a trend (p<0.1).
