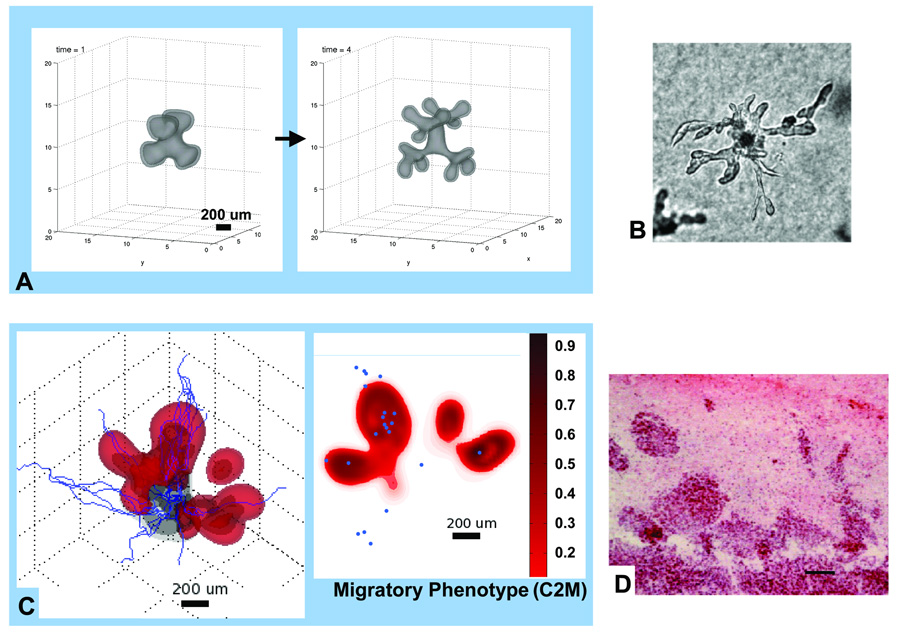
Figure 2.
Variability and persistence of morphologic patterns predicted by the mathematical model simulating heterogeneity in vitro (A) [10,40] and in vivo (C) [12,11]. In both cases, only the higher-grade clone 2 is simulated (no mutations) although the clone is allowed to acquire a hypoxic-induced migratory phenotype (Supplement). (A): Proliferation is downregulated and the clone migrates up oxygen gradients towards the far-field boundary (computational box not shown) (arrow: time direction). (C): red denotes migratory phenotype of tumor clone 2 (C2M) while gray denotes less motile clone 2 (C2). Proliferation of both clones is regulated by oxygen levels. Darker interior region of 3D graph denotes necrotic region. 2D horizontal slice shows distribution of C2M; small blue circles indicate position of mature, blood-conducting vessels. Morphological instability occurs in both simulations because this clone’s cell adhesion is low, resulting in cell strands in (A) and fingers and detached clusters in (C). Simulations are supported by experimental observations revealing morphologic instability after inducing hypoxia in spheroids in vitro (B) [Reprinted from Cancer Cell, Vol. 3, Pennacchietti et al. [16], p. 354, Copyright (2003), with permission from Elsevier] and in xenografts in vivo (D) [Adapted from [17]; bar = 80 µm; reprinted with permission from Rubenstein et al., Neoplasia, Vol. 2, p. 311, (2000). Copyright © Neoplasia].

