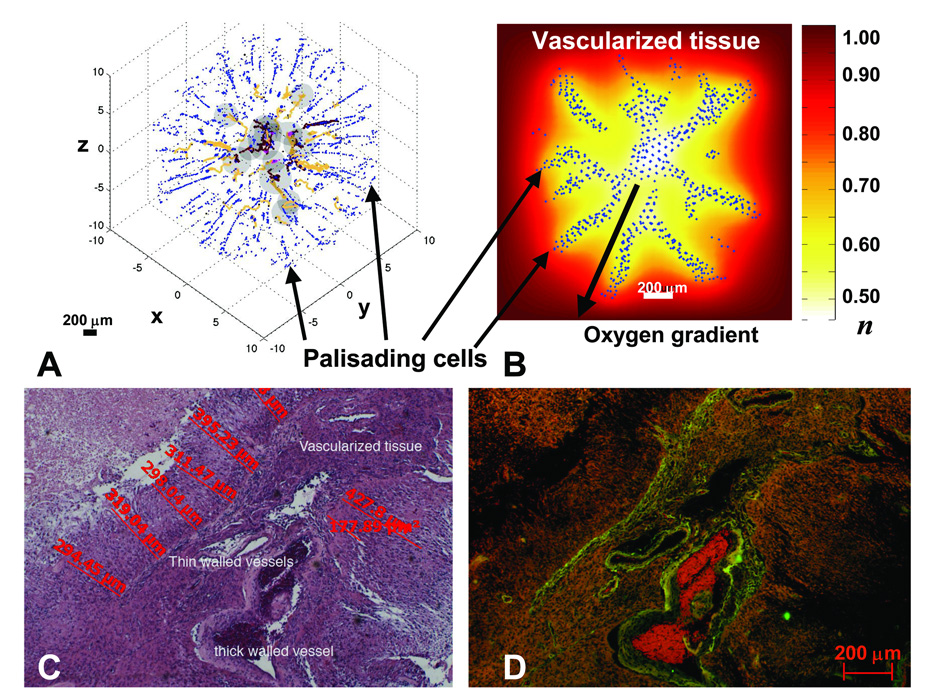
Figure 3.
Palisading glial cells invade vascularized tissue as predicted by the model (A,B) and observed in histology (C,D). A: Computer simulation showing palisading cells escaping from the peri-necrotic region (dark gray) by undergoing a hypoxia-induced phenotypic change to upregulate motility and downregulate adhesion and proliferation. Cell-migration occurs via chemotaxis and haptotaxis in response to gradients of oxygen and ECM concentration, respectively (Methods). Brown: conducting vessels; yellow: non-conducting. B: Background shows distribution of oxygen concentration (“n” in legend). n=1 in vascularized tissue and is lower in the tumor (white/yellow: peri-necrotic region). C: 4x magnification of a high-grade glioblastoma interior. D: Corresponding fluorescent image showing vessels (green, red). As predicted by the simulations (A,B), palisading malignant glial cells (C) invade the vascularized tissue (D), amidst a tangle of thick and thin-walled large vessels and a few smaller vessels, from two areas of necrosis. Also note the distances between necrosis and vessels (C), corroborating our choice for diffusion penetration length L2 (Supplement). Further phenotypic changes (e.g. down-regulation of motility and up-regulation of proliferation) may occur when migrating cells reach tissue regions richer in substrates, leading to the morphologies described in Fig. 4D,5A–D.

