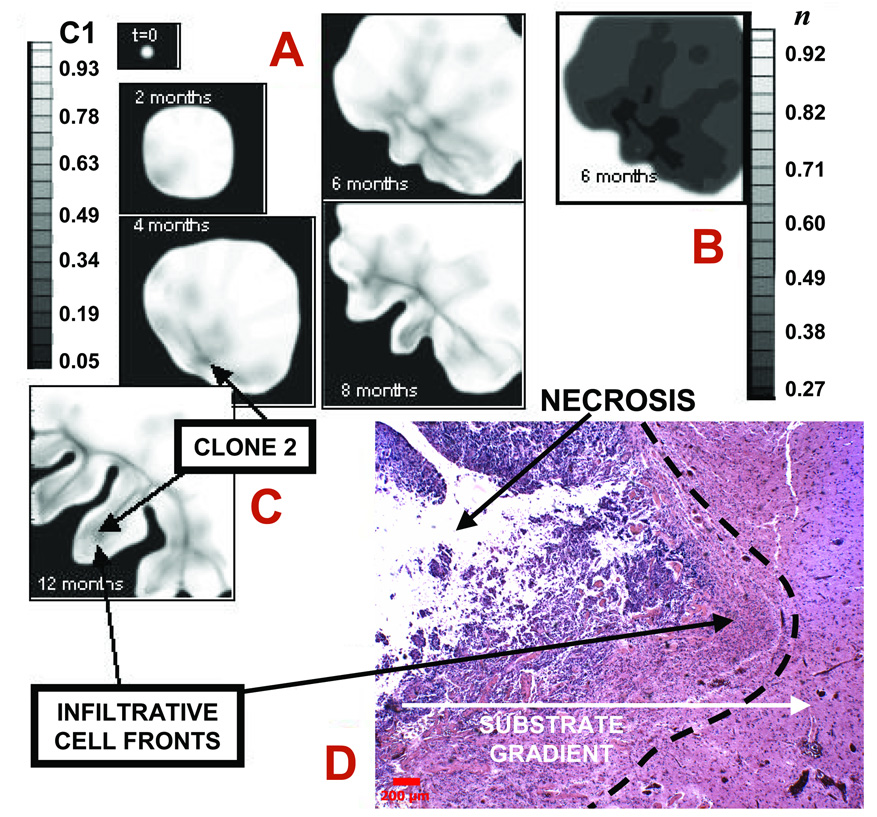
Figure 4.
Infiltration of a high-grade glioma. A: Computer simulation in proliferative growth stage (field of view=6–10 mm). For each time-snapshot, two-dimensional slices depict spatial distribution of two different clones: genotype ℳ = {1,0} (lower-grade clone 1, “C1”) evolving to ℳ = {0,1} (higher-grade clone 2, “C2” = 1-C1) (Materials and Methods). Legend: local mass fraction of C1. Arrows pointing to darker areas in the tumor indicate C2. B: Simulated oxygen 23 concentration (“n” in legend) at 6 months, indicating hypoxic gradients (n=1 in normal brain and is lower in tumor). The larger oxygen uptake of C2 enhances local hypoxia (e.g., lower-left tumor corner), and leads to shape instability whereby clusters of C2 cells protrude “finger-like” into the tumor mass of C1 first, and host brain later. The model predicts that C2 expansion is the main determinant of tumor morphology. C: Tumor detail at 12 months showing invading fingers. D: Histology section of a tumor front (left) showing an invading finger into more normal brain (bar, 200 µm). Normal brain (white matter) has fewer cell bodies and more abundant amorphous matrix (right). Invading malignant astrocytes (left) have pleiomorphic nuclei and an irregular distribution. Note the clearly demarcated margin (left of dashed line) between tumor and more normal brain. Neo-vascularization (and inflammation) at tumor-brain interface is visible as darker spots to the right in brain parenchyma, implying that substrate gradients drive collective tumor cell infiltration into the brain. Morphology and size of the invading finger are consistent with simulation predictions (A,B) suggesting the proliferative growth stage.

