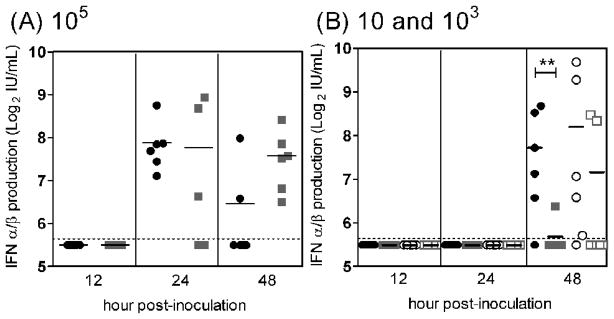
Figure 3.
Mice inoculated with WNVC6/36 produced IFN-α/β earlier than mice inoculated with WNVBHK. Mice were inoculated subcutaneously with (A) 105 PFU of WNVC6/36 (●) or WNVBHK ( ), (B) 10 PFU of WNVC6/36 (●) or WNVBHK (
 ) or 103 PFU of WNVC6/36 (○) or WNVBHK (□) in the left rear footpad. Sera were harvested at different times post-inoculation, and IFN bioassays were performed on L929 cell monolayer. Data from two independent experiments are shown. Solid lines indicate the geometric mean of 6 mice per group. Dashed lines represent the limit of detection (LOD), and data points below the line are < LOD. Asterisks show significant difference between groups (Mann-Whitney test: ** p <0.05).

