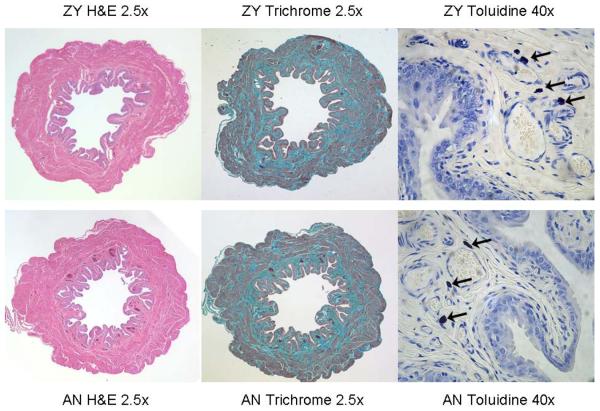
Figure 2.
Examples of Hematoxylin & Eosin (left panels), Gomori's Trichrome (middle panels) and Toluidine Blue (right panels) stains in Neonatal Zymosan (upper panels) and Neonatal Anesthesia (lower panels) treatment groups. Arrows in panels at right indicate individual mast cells. Comparisons of the two treatment groups demonstrated no quantitative differences.

