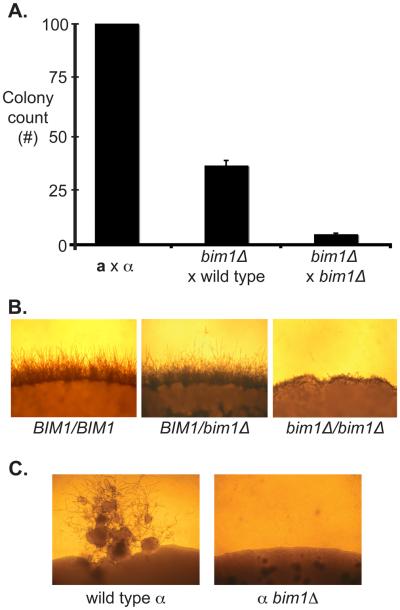
Figure 4.
A. bim1Δ crosses show reduced diploid formation. Equal numbers of each mating type were crossed and selected for diploids. Colony counts are graphed as a percentage of wild type colony number. X-axis represents the crosses that were carried out. Y-axis represents normalized number of colonies recovered. B. bim1Δ diploids show defects in filament formation. The edges of wild type and mutant diploid colonies are shown after growth under sexual development conditions. 100X magnification. C. bim1Δ strains are unable to undergo monokaryotic fruiting. Panels show monokaryotic fruiting from a wild type α haploid (left) and a bim1Δ α haploid (right) grown on filament agar for 2 weeks.

