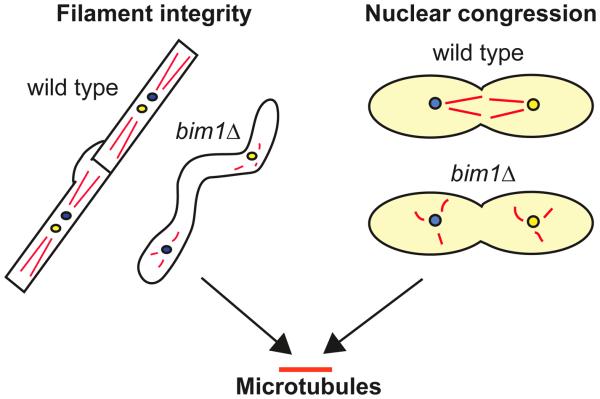
Figure 6.
Model for the role of BIM1 in C. neoformans. Phenotypic analyses of bim1Δ strains revealed that the loss of Bim1 manifests itself in two primary ways: a loss of filament integrity, and a likely disruption of nuclear congression. Both of these phenotypes are consistent with Bim1 acting through the microtubule cytoskeleton. Left hand schematic represents sexual development filaments in wild type and bim1Δ cells. Right hand schematic shows yeast cells in wild type and bim1 crosses during diploid formation. Red lines represent microtubules. Yellow and blue circles represent a and α nuclei.

