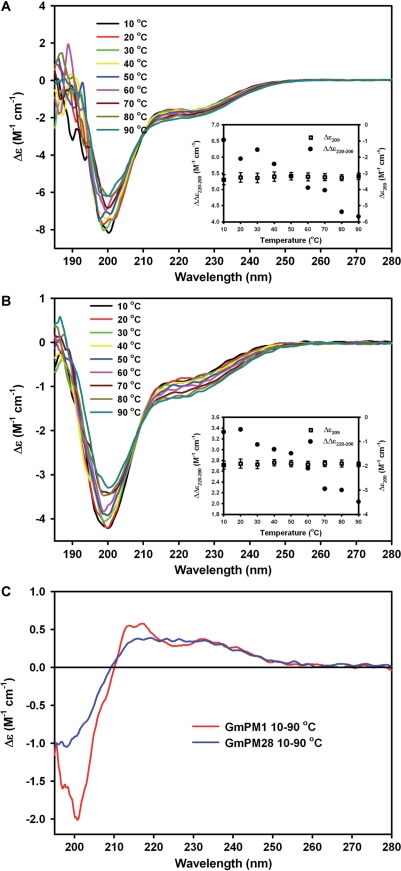
Fig. 1.
Far-UV CD spectra of GmPM1 (A) and GmPM28 (B) to analyze the effect of increasing temperature on the protein secondary structures. The spectra were measured in 10°C increments in 10 mM potasium phosphate buffer, pH 7.0, from 10 to 90°C. The inserts show the temperature-induced refolding of both proteins by using the difference of spectra at 220 and 200 nm. (C) Difference spectra obtained after subtracting the spectra of both proteins from spectra obtained at 10 and 90°C.

