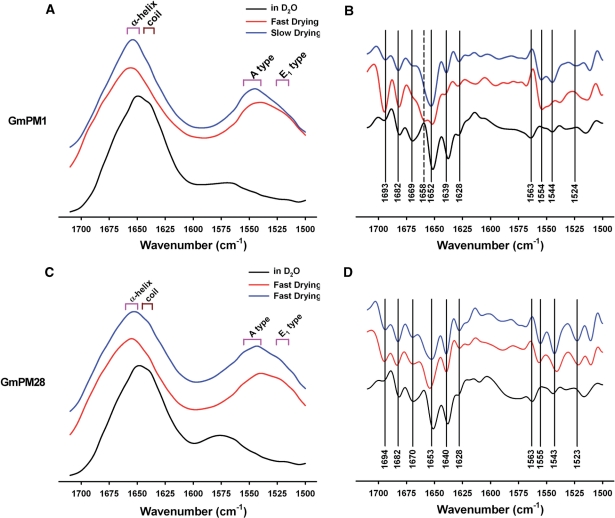
Fig. 3.
FTIR absorption and second-derivative spectra in the amide regions of GmPM1 (A, B) and GmPM28 (C, D). These panels display the spectra of proteins in D2O (black), and after fast drying (red) and slow drying (blue). The oblongs in A and D show the α-helix bands (pink) in the amide-I and -II regions, or random coil bands (dark pink) in the amide-I region. The band positions of second-derivative spectra are basically accounted for by the spectra of slow drying, except the band at 1,658 cm−1 (B) and at 1,563 cm−1 (B, D) which are determined by the spectra of GmPM1 proteins after fast drying and in D2O.

