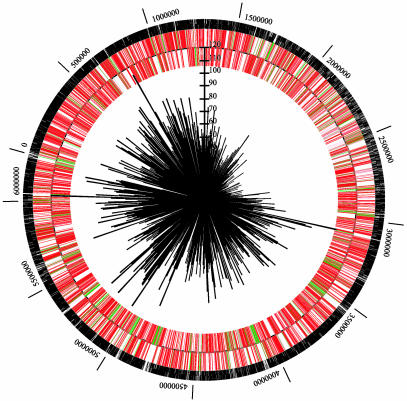
Fig. 4.
Distribution of transposon insertions and candidate-essential genes. The circular 6.2-Mbp P. aeruginosa genome was hit in 30,100 locations with individual transposon insertions. The black circular line represents the genome sequence with the origin of replication at coordinate zero. Bars outside the line represent genes transcribed clockwise, whereas those inside are transcribed counterclockwise. Red bars represent ORFs that contain transposon insertions, and green bars represent ORFs not hit (candidate-essential genes). Black marks on the outside of the circle represent transposon insertions. The sunburst pattern represents the number of insertions per 10,000 bp, with the scale extending from the center.

