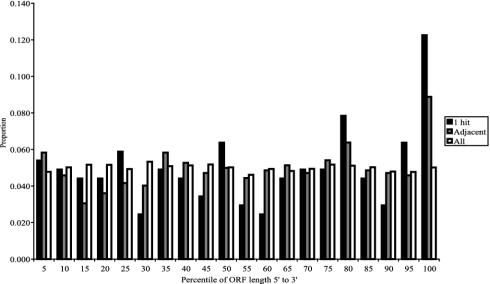
Fig. 6.
Hit distribution relative to position within ORF. The proportion of transposon insertions according to their relative position within ORFs is represented in a histogram. Hits are nearly evenly distributed (e.g., 5% of hits occur in the first 5% of ORFs) when all insertions are considered. For ORFs that were hit only once (dark gray), particularly those adjacent to ORFs never hit, the proportion of hits is highly skewed toward the 3′ end of the gene.

