Figure 7.
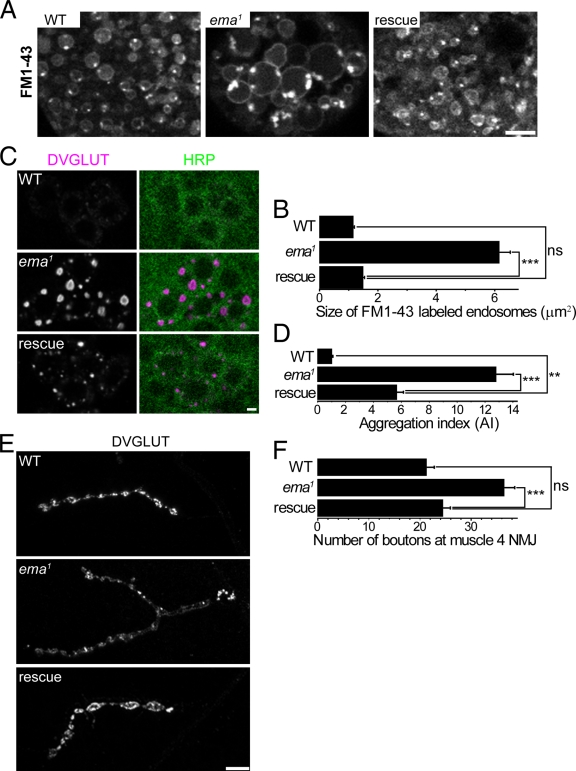
Human Clec16A rescues ema. (A and B) Human Clec16A rescue of enlarged endosomes in the ema mutant garland cells. (A) Representative confocal images of live FM1-43–labeled endosomes from wild-type (WT), ema1, and rescue (ema1; actin5C-Gal4, UAS-GFP::hClec16A) garland cells. (B) Quantification of the size of live FM1-43–labeled endosomes for the genotypes in A. n > 200 for all genotypes. (C and D) Human Clec16A rescue of DVGLUT aggregates in the ema mutant motoneurons. (C) Representative confocal images of wild-type (WT), ema1, and rescue (BG380-Gal4, UAS-GFP::hClec16A; ema1) motoneuron cell bodies labeled for DVGLUT protein (magenta) and the neuronal membrane marker HRP (green). Bar, 2 µm. (D) Quantification of DVGLUT aggregation for the genotypes in C. Aggregation index (AI) of a motor neuron = total DVGLUT density × average size of DVGLUT aggregates in that neuron. n > 30 for all genotypes. (E and F) Human Clec16A rescue of synaptic overgrowth at the ema mutant NMJs. (E) Representative confocal images of wild-type (WT), ema1, and rescue (BG380-Gal4, UAS-GFP::hClec16A; ema1) type Ib NMJs at the muscle 4 labeled for DVGLUT protein. The ema1 image was taken at a higher gain for clarity. Bar, 10 µm. (F) Quantification of number of type Ib synaptic boutons at muscle 4 for the genotypes in E. n > 10 for all genotypes. For B, D, and F, data represent mean ± SEM. ANOVA analysis. **, P < 0.01; ***, P < 0.001; ns, not significant.

