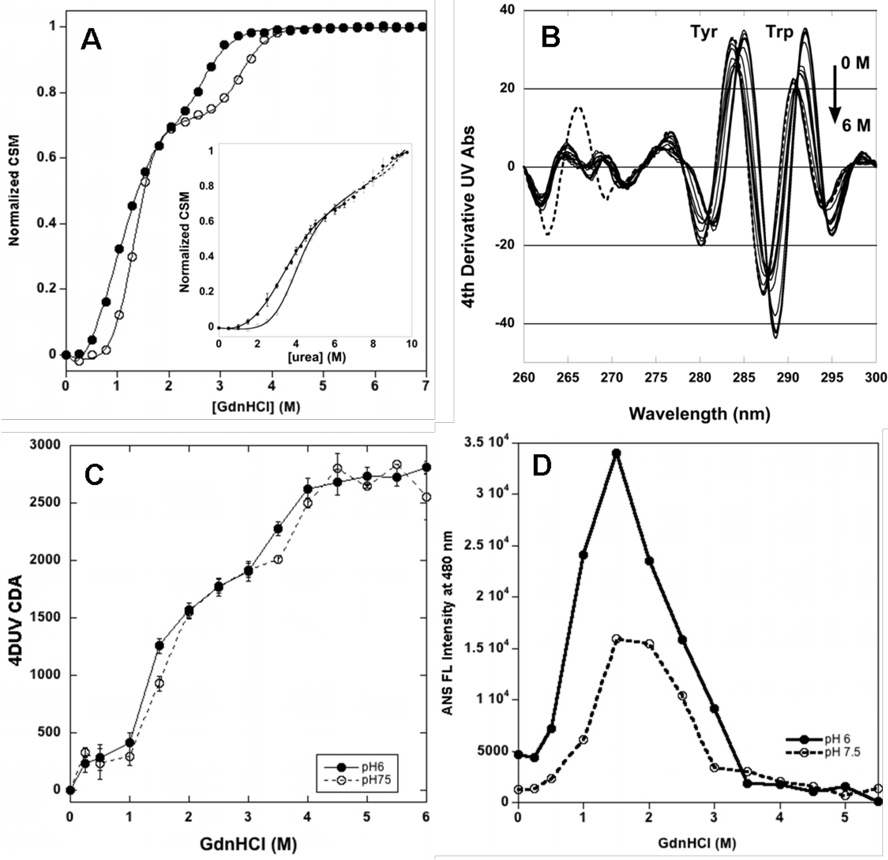
Figure 6.
A. GdnHCl denaturation of abatacept at 25 C at pH 6 (filled circles) and pH 7.5 (open circles) monitored by fluorescence. Insert: Fluorescence scans in 0–6 M GdnHCl at pH 6 at 25 °C, between 310–390 nm, ex wl 295 nm. B.. Denaturation curves in 0–9.75 M urea of ca 2 mM abatacept at 25 °C at pH 6 (filled circles) and pH 7.5 (open circles) in 10 mM sodium phosphate buffer and 25 mM NaCl. Insert: Fluorescence scans at pH 6 between 310–390 nm, ex wl 295 nm. C. Denaturation curve in 0–6 M GdnHCl of ca 5 mM abatacept at 25 °C at pH 6 (filled circles)and pH 7.5 (open circles) in 10 mM sodium phosphate buffer and 25 mM NaCl. Insert: 4d UV scans at pH 6 between 260–310 nm. D. ANS binding to abatacept (ca 100:1 molar ratio) at pH 6 (filled circles) and pH 7.5 (open circles) in 0–5.5 M GdnHCl at 25 °C in 10 mM sodium phosphate buffer with 25 mM NaCl.

