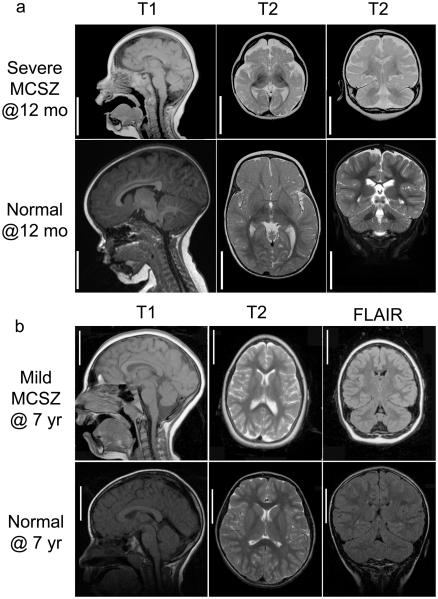
Figure 2. Brain MRIs of MCSZ patients.
Representative MRI images are shown from Families 4 (a, severely affected) and 7 (b, moderately affected) with aged matched controls. MRIs of severely affected patients from other families were similar to the representative images in a. Sagittal images are shown on the left (T1), axial images in the middle (T2) and coronal images on the right (T2 (a) and FLAIR (b)) with the MRI sequence noted above the image. The MRIs illustrate that despite the microencephaly (small brain), the gyral pattern is not clearly abnormal indicating absence of visible neuronal migration abnormality. The cerebellum is proportionately small compared to the cerebrum and the subpallium (basal ganglia or ventral cerebrum) is proportionately with the pallium (dorsal cerebrum). There is no evidence of atrophy or glial scarring. Bar=5 cm for both unaffected and MCSZ images.

