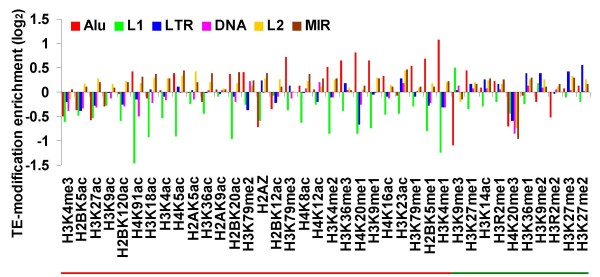
Figure 1.
Enrichment or depletion of 38 individual histone modifications in transposable element (TE) families. Log2 normalized ratio of the number of tags of each of the 38 histone modifications located within each TE family over the total number of tags taken as the genomic background is shown. Statistical significance determined by the G test (see Additional file 1, Table S1).

