Figure 2.


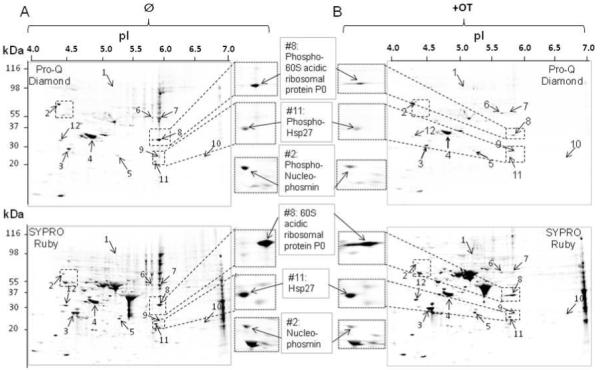
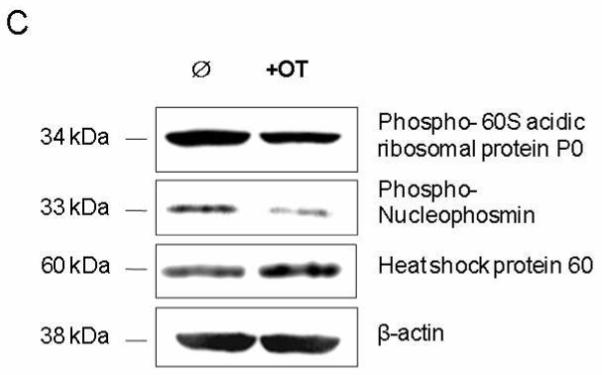
Separation of phosphor proteins by two-dimensional gel electrophoresis (2-DE). Phosphor proteins (A & B, top panel) were separated by 2-DE (4/7) and first stained by using the ProQ-diamond kit, followed by SYPRO Ruby stain for the detection of total proteins on the same gel (A & B, lower panel). The numbered spots with arrows on 2-D gel show proteins suppressed by OT treatment and identified by MS and listed in Table 1. Examples of the suppressed protein spots (p<0.05) by OT treatment (left-hand side of panel B) as compared to control (right-hand side of panel A) were shown. C), Confirmation of proteins suppressed by OT treatment using Western blot analysis. Please see the Materials and Methods section for details. OT experiments were repeated four times and all the 2-DE experiments were performed in triplicate with variation <10%.
