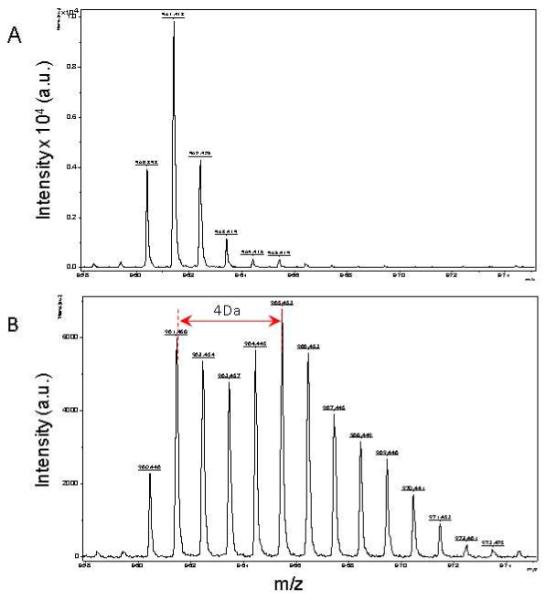
Figure 3.

Mass spectra of 960 m/z fragment from Hsp27 of lysates of cells grown in the presence of natural amino acids (Panel A), and 50% enriched 15N algal amino acid mixtures (Panel B). MS spectrum of control in Panel A shows the binomial distribution of isotopomic peaks largely due to natural existence of 13C. Incorporation of 15N resulted in an obvious mass shift in isotopomic distribution in Panel B. The synthesis rate of a protein was based on the isotopomer distribution of these two spectra.
