Figure 5.


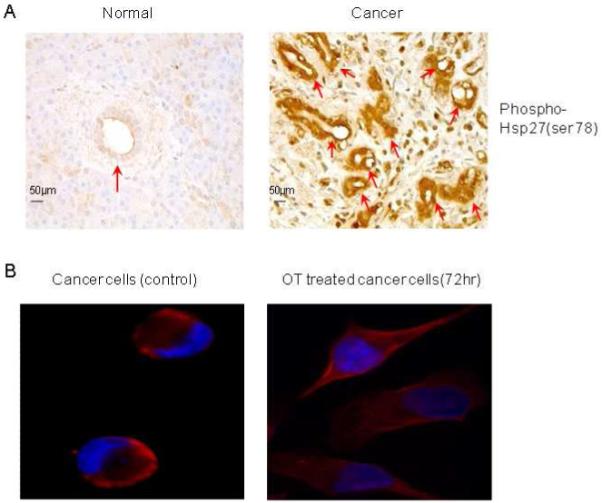
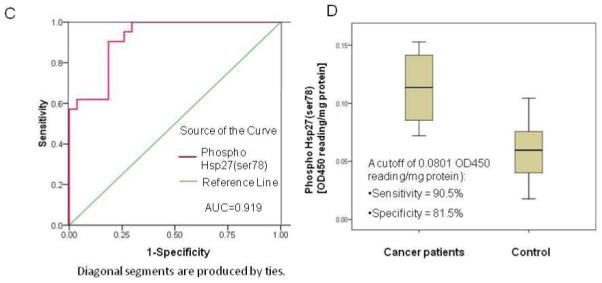
Functional validation of phosphor Hsp27 by analyses of ELISA and immunohistochemistry (IHC). Panel A shows the overexpression of phosphor Hsp27 at Ser78 in human pancreatic cancer tissue and its adjacent tissue (n=10). The arrows indicate overexpression of phosphor Hsp27 at Ser78 in ductal cells. Panel B shows cellular localization of phosphor Hsp27 (ser78) in MIA cancer cells in the presence or absence of OT. Panel C shows receiver operator characteristic curves for the diagnosis of pancreatic adenocarcinoma versus noncancerous cases. Curves demonstrate relative accuracy for individual serum phosphor Hsp27 (ser78) levels to discriminate between pancreatic cancer and control cases. Serum levels in healthy control subjects (n = 12) with age-matched from a new independent sample set were considered true-negative cases, whereas serum levels in patients with cytologically confirmed pancreatic adenocarcinoma (n = 12) from a new independent sample set were considered true-positive cases. The area under the curve (AUC) was 0.919 [95% confidence interval (CI): 0.845 to 0.993]. At a cutoff of 0.0801 OD450 reading/mg protein, the sensitivity was 90.5% (CI 81.0% to 99.3%) and the specificity was 81.5% (CI 70.4% to 81.5%). Panel C shows box plot of relative serum concentrations of phosphor Hsp27 (ser78) for controls and pancreatic cancer patients for an independent sample set. The lines inside the boxes denote the medians. The boxes represent the interval between the 25th and 75th percentiles, and the whiskers indicate the interval between maximum and minimum. The median concentrations for patients and controls were 0.114 OD450 reading/mg protein and 0.06 OD450 reading/mg proteins, respectively. Please see the Materials and Methods section for details. All the experiments were repeated in three times.
