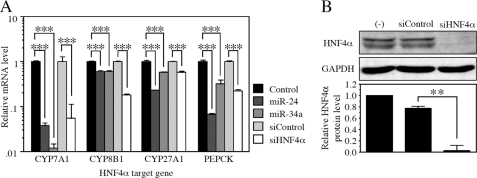
FIGURE 5.
Down-regulation of various HNF4α target genes by miR-24 and miR-34a as well as siHNF4α. A, the mRNA levels of various targets of HNF4α in HepG2 cells were examined by real time RT-PCR and normalized with the GAPDH mRNA level. The data are relative to that transfected with control or siControl. Each column represents the mean ± S.D. of three independent experiments. ***, p < 0.001. B, the HNF4α and GAPDH protein levels in HepG2 cells were determined by Western blot analyses. The data are relative to no transfection (−). Each column represents the mean ± S.D. of three independent experiments. **, p < 0.01.

