FIGURE 3.
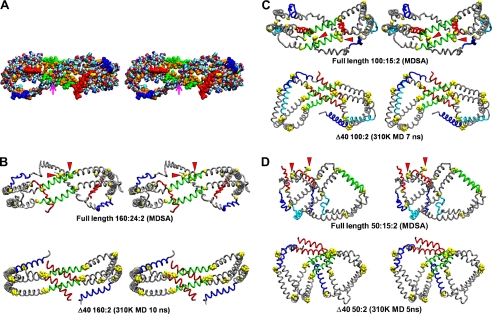
Cross-eyed stereo images of average final structures of apoA-I double belt in the three MDSA sets created from calculated average coordinates compared with the initial MD simulation study of particles containing truncated apoA-I subjected to short (10 ns) MD simulations at 310 K (16). A, average space-filling all-atom final structure of MDSA simulations of the 160:24:2 particle set. The particle is viewed from the overlap domain. Helix 5 (green), helix 10 (red), helix 1 (blue), leucines (gold), and remainder of protein (CPK, where CPK is Corey, Pauling, and Koltun coloring) are shown. The point of contact of the N-terminal proline-rich domains is indicated by a magenta arrow. B–D, average final structures of MDSA simulations of each of the three sets, 160:24:2, 100:15:2, and 50:8:2 (upper rows), are compared with the final structure (lower rows) of a comparable particle with truncated apoA-I subjected to short (10 ns) MD simulations at 310 K (16). The apoA-I double belts are viewed from the helix 5 domain. The protein is represented as a Cα backbone model except proline (space-filling yellow), helix 5 (green), helix 10 (red), helix 1 (blue), helix 8 (cyan), and remainder of protein (gray). The N-terminal G0 (proline-rich) domains are indicated by red arrowheads.

