FIGURE 2.
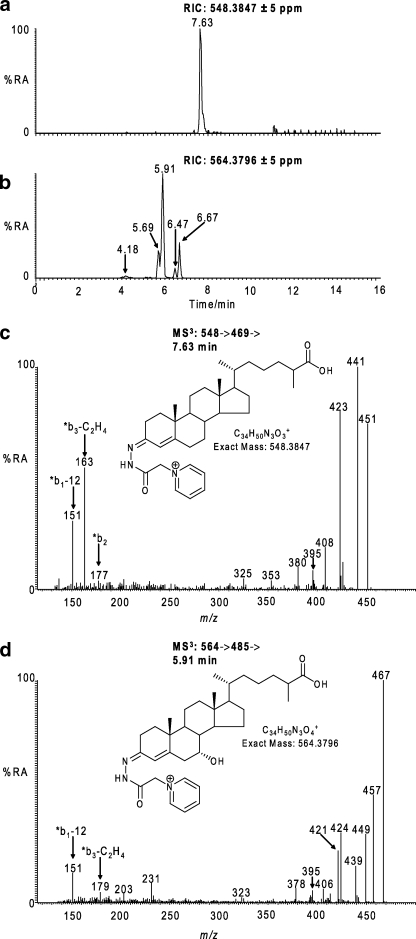
Identification of hydroxycholestenoic and hydroxyoxocholestenoic acids in CSF. a and b, RICs for the exact m/z 548.3847 (a) and 564.3796 (b) ±5 ppm. c, MS3 [548→469→] spectrum of the peak eluting at 7.63 min in RIC (a). d, MS3 [564→485→] spectrum of the peak eluting at 5.91 min in RIC (b). The MS3 spectra correspond to GP-tagged 3β-hydroxycholest-5-en-26-oic (c) and 7α-hydroxy-3-oxocholest-4-en-26-oic acids (d). Structures of the GP-tagged molecules are shown as insets to the appropriate spectra. GP-tagged 7α-hydroxy-3-oxocholest-4-en-26-oic acid appears as syn and anti conformers in RIC (b). The syn and anti confirmers appear to give split peaks in RIC (b) (i.e. 5.69 and 5.91 min and 6.47 and 6.67 min). The MS3 spectra for these peaks are indistinguishable; however, only the latter eluting peaks (5.91 min, 6.67 min) appear in the RIC of the authentic reference compound. The origin of the early eluting peaks is unknown but may be related to the stereochemistry of the C-17 side chain. 7β-Hydroxy-3-oxocholest-4-en-26-oic is the minor component eluting at 4.18 min in RIC (b). Chromatograms and spectra are from sterols isolated from CSF, and recorded as indicated in Fig. 1. %RA, % relative abundance.

