FIGURE 4.
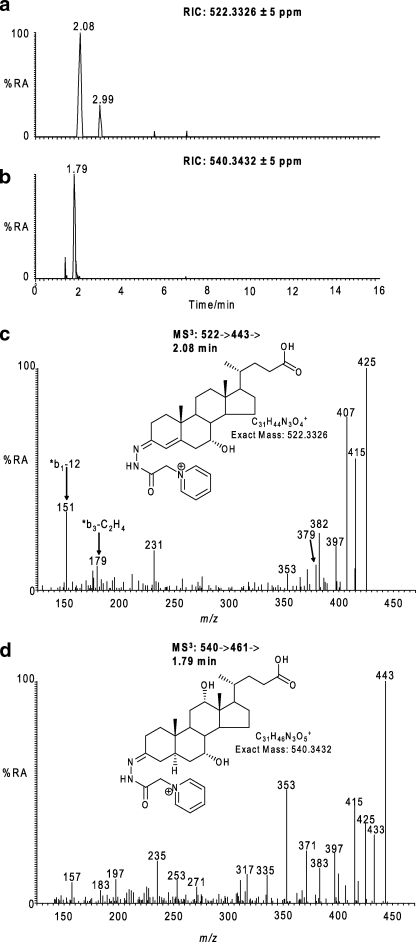
Identification of C24 bile acids in CSF. RICs for the exact m/z 522.3326 (a) and 540.3432 (b) ± 5 ppm are shown. c, MS3 [522→443→] spectrum of the peak eluting at 2.08 min in RIC (a). d, MS3 [540→461→] spectrum of the peak eluting at 1.79 min in RIC (b). The MS3 spectra correspond to GP-tagged 7α-hydroxy-3-oxochol-4-en-24-oic (c) and a trihydroxycholanoic acid, possibly 3β,x,y-trihydroxy-5α-cholan-24-oic acid (d). Proposed structures of the GP-tagged molecules are shown as insets to the appropriate spectra. Chromatograms and spectra are from sterols isolated from CSF and recorded as indicated in Fig. 1. %RA, % relative abundance.

