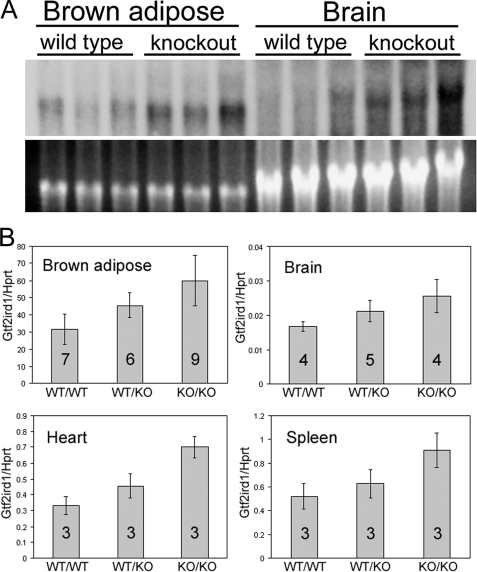
FIGURE 2.
Gtf2ird1 transcript production approximately doubles in the tissues of Gtf2ird1tm1Hrd knock-out mice. A, Northern blot of total RNA extracted from brown adipose and brain tissue of three wild-type and three homozygous knock-out mice showing that the 3.5-kb Gtf2ird1 band is more intense in all three knock-out mice. Close scrutiny also shows an expected slight reduction in transcript length because of the loss of exon 2 (129 bp) in the knock-out samples. B, quantitative RT-PCR analysis of Gtf2ird1 levels. Error bars show S.D., and the numbers indicate the number of mice used. Unpaired two-tailed Student's t tests show a difference between wild-type (WT/WT) and homozygous null (KO/KO) genotypes with a probability of: p = 0.0011 for brown adipose, p = 0.012 for brain, p = 0.0019 for heart, and p = 0.022 for spleen.

