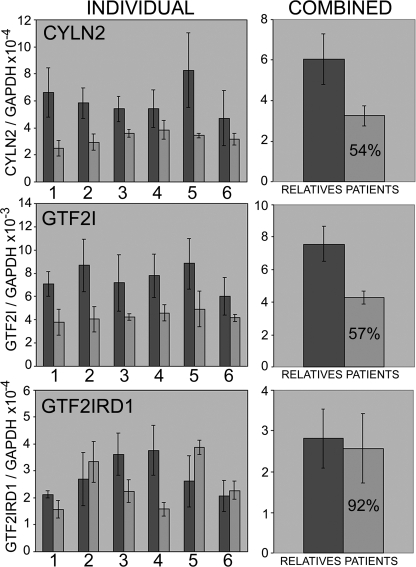
FIGURE 3.
Quantitative RT-PCR analysis of CYLN2, GTF2I, and GTF2IRD1 expression in lymphoblastoid cell lines derived from Williams-Beuren syndrome patients and their relatives. Error bars show S.D., and the figure in the patient bar indicates the estimated mean expression level as a percentage of the relatives' mean. Paired two-tailed Student's t tests show differences between the means of genotype groups with a probability of: CYLN2 p = 0.004575, GTF2I p = 0.000342, and GTF2IRD1 p = 0.559668.

