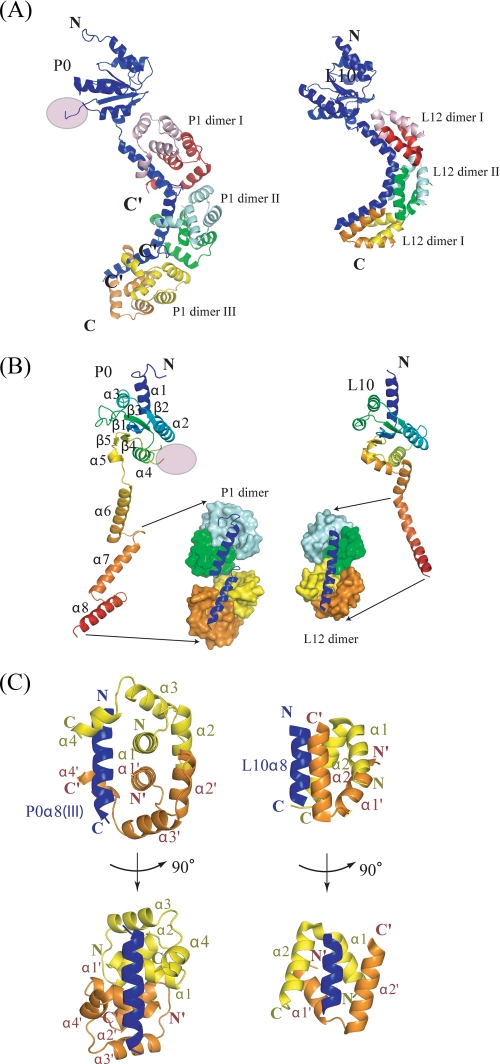
FIGURE 2.
Structural comparison between archaeal (left) and eubacterial (right) stalk complex. A, ribbon representation of the overall structure of the archaeal (left) and eubacterial (right) stalk complex showing the N-domain at the top. The disordered insertion region is shown as a pink circle. P0 (or L10) is colored blue, while three P1 (or L12) dimers bound to the spine helices are colored pink/red, cyan/green, and yellow/orange, respectively. The truncated C termini of all P1 dimers are indicated by C′. B, rainbow representation of P0 (left) and L10 (right) showing their N-terminal domains have a similar fold except for the disordered insertion region. P1 dimers (or L12 dimers) bound to the second and third spine helices (the first are not depicted for clarity) are shown as a space-filling model. C, orthogonal view of the interactions between P0 and P1 dimer (left), and L10 and L12 dimer (right). The secondary structures are labeled in the same color as in the structure, where the prime symbol refers to the second monomer. All structure figures were prepared with the program PyMOL (DeLano Scientific LLC, San Carlos, CA).

