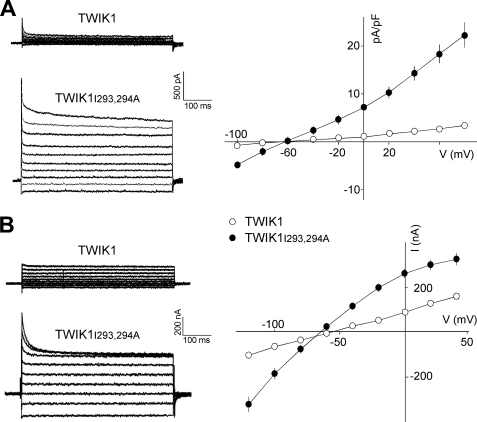
FIGURE 3.
Electrophysiological characterization of TWIK1 and TWIK1I293A,I294A in MDCK cells (A) and Xenopus oocytes (B). A left, current traces recorded in MDCK cells during voltage pulses ranging from −100 mV to +80 mV in 20-mV steps from a holding potential of −80 mV. Right, current density was determined at all test potentials from the steady-state currents and the whole cell capacitance recorded as in the left panel. Each value is the mean ± S.E., n cells for TWIK1 (n = 10), TWIK1I293A,I294A (n = 9). B left, current traces recorded in Xenopus oocytes during voltage pulses ranging from −120 mV to +40 mV in 20-mV steps from a holding potential of −80 mV. Right, current-voltage relationships deduced from steady-state currents recorded as in the left panel. Each value is the mean ± S.E., n cells for TWIK1 (n = 29), TWIK1I293A,I294A (n = 31).

