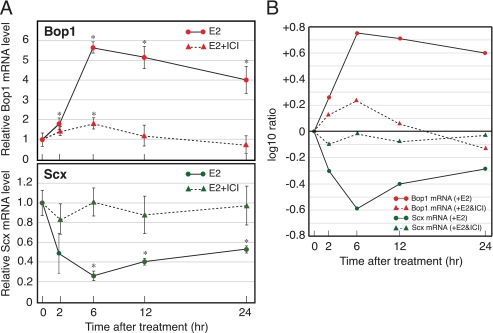
FIGURE 2.
Expression of the Bop1 and Scx genes in the E2-treated OVX mouse uterus. Animals (six or four mice per group) were administered E2 with (dashed line) or without (solid line) ICI, and uterine total RNA was prepared at the times indicated. A, the mRNA levels of Bop1 (upper panel) and Scx (lower panel) gene were quantified by real-time PCR as described under “Experimental Procedures.” Results were normalized to the level of 18 S in each sample. The values are the means ± S.D. *, p < 0.01 compared with time 0. B, the result expressed as the log 10 ratio for changes relative to time 0 to compare the changes between Bop1 and Scx mRNA levels.

